As the tides continue to roll toward value-based care, evaluating quality metrics is more important than ever. In fact, many leaders in quality and patient safety are beginning to demonstrate that their departments can also be profit centers within their facility.
Historically, many quality and safety departments, when advocating for better tools or more resources or personnel, were viewed as a drain on the bottom line. But leaders such as Brent James, former chief quality officer of Intermountain Healthcare and one of the authors of the seminal report from the Institute of Medicine, To Err is Human: Building a Safer Healthcare System, are leading the charge to change that mindset.
Compared to cost-cutting and other strategic efforts, quality improvement is “at least two orders of magnitude, a factor of 100 times bigger, than any other financial opportunity (providers) have in growth and in revenue enhancement,” James said in his presentation at the 2019 NAHQ National Healthcare Quality Summit.
While the IOM report contended that 30-50% of all healthcare expenditures are wasted, James argues that waste is higher, at 65%. “Improving quality of care takes the waste out,” James says. “It completely dominates any other financial opportunity in healthcare, and it comes from better clinical quality.”
Still, not all quality and safety professionals have advanced expertise in financial modeling to be able to convince senior leadership with hard data that a new tool or more resources are not only affordable but prudent and profitable. Thus, American Data Network (ADN) has made available a variety of free, easy-to-use tools to do just that.
Patient Safety Return-On-Investment (ROI) Calculator
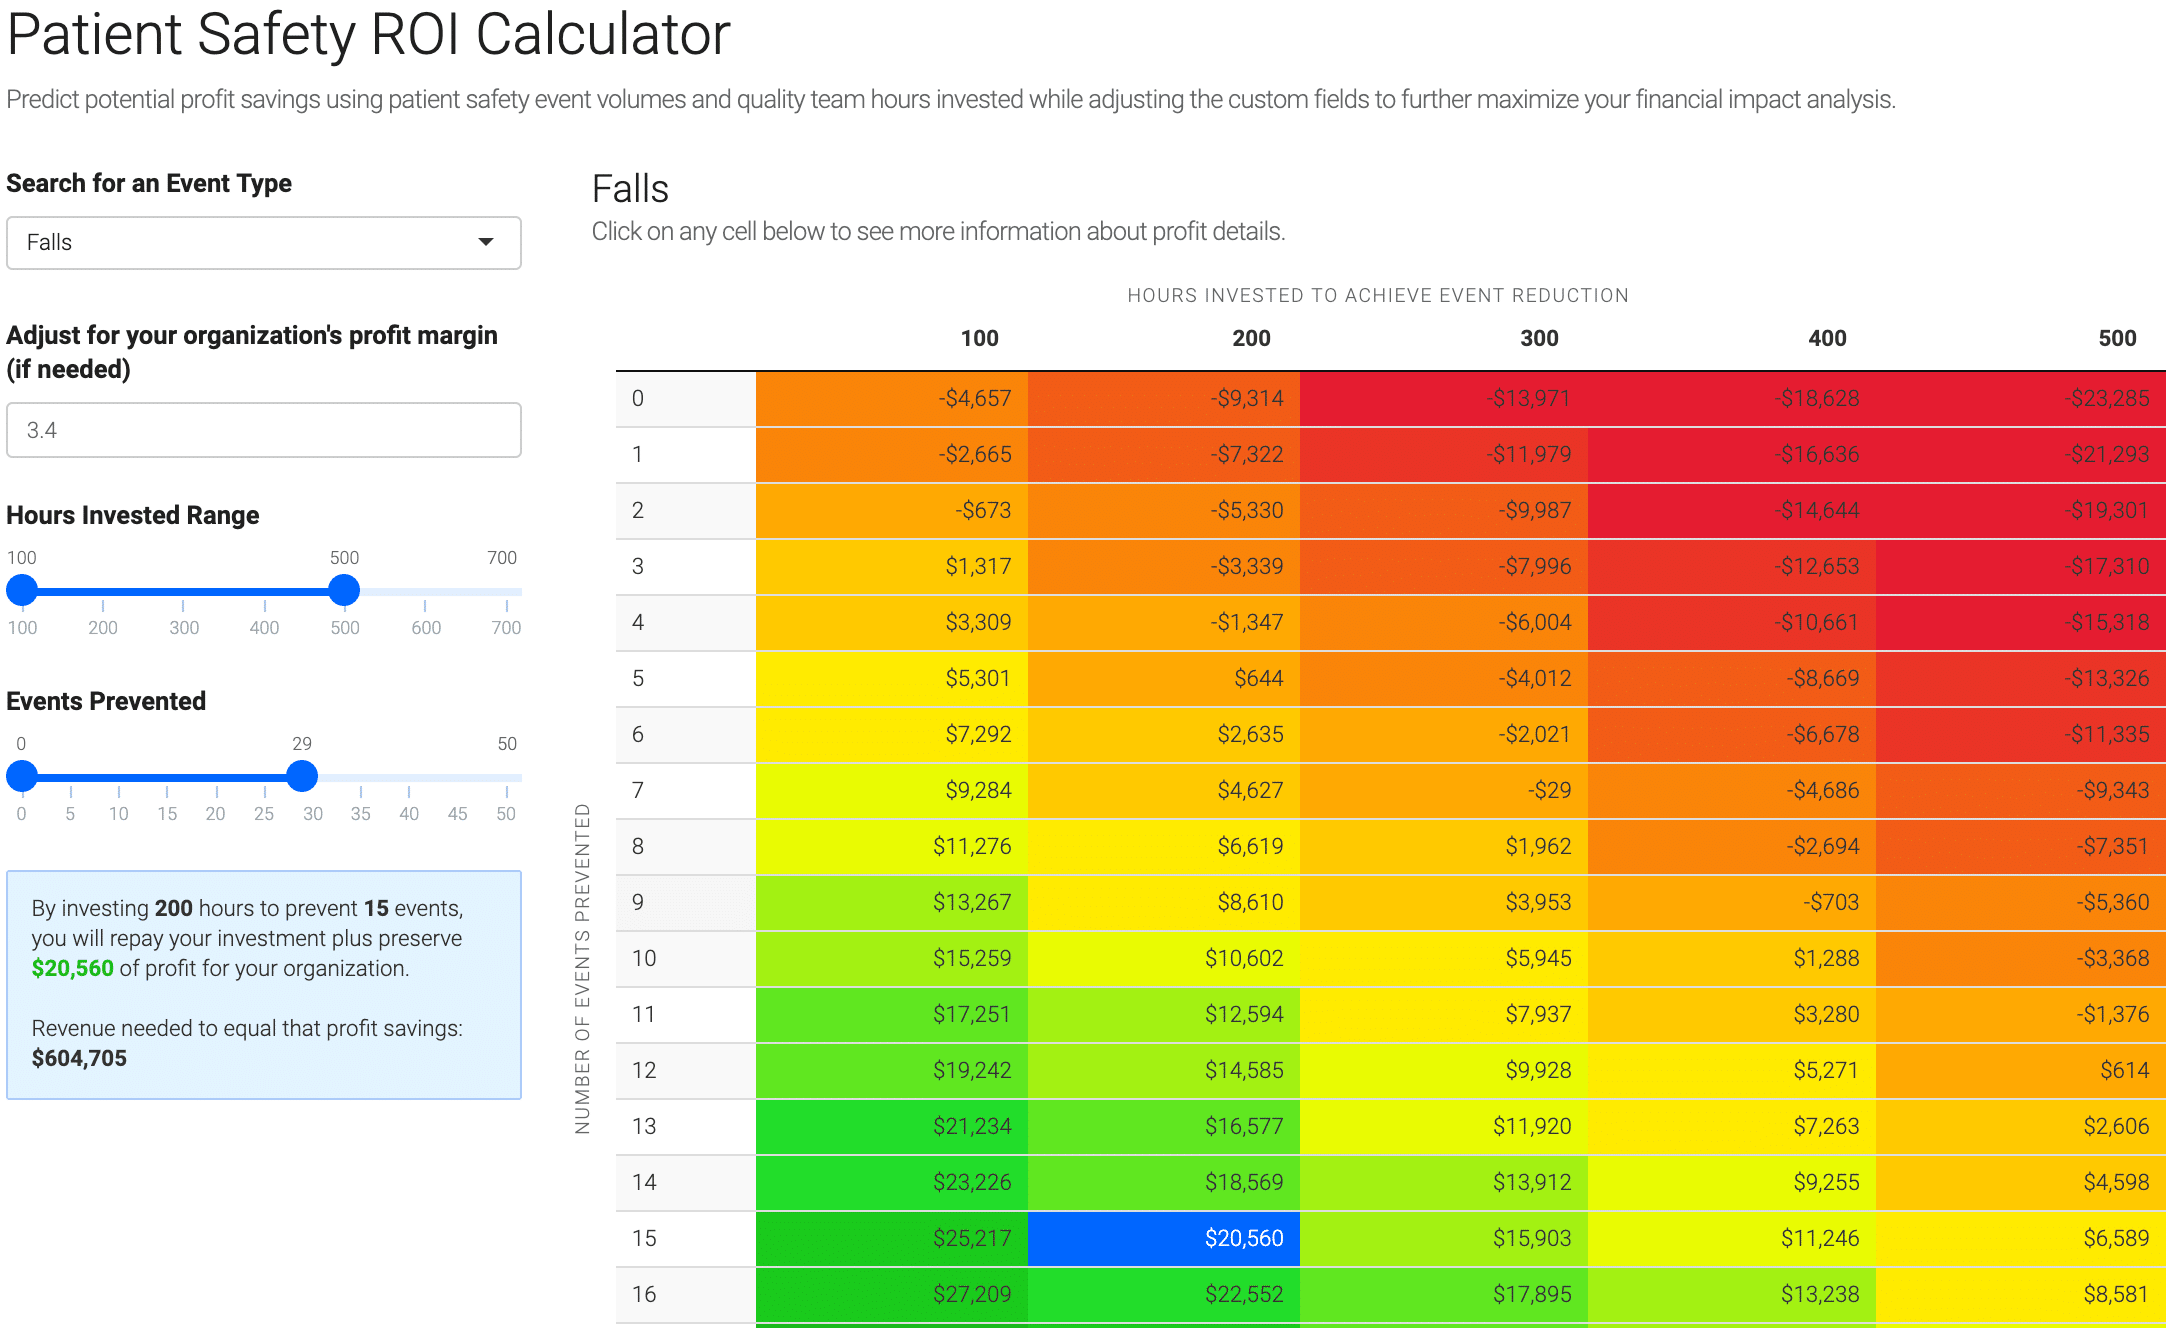
The Patient Safety ROI Calculator can help your team predict how much profit can be saved from a patient safety or quality initiative that prevents a certain number of adverse events while also taking into account the soft cost of team time. Patient safety initiatives can provide a substantially positive financial impact on hospitals and especially systems.
The calculator allows you to select from many different event types to evaluate the financial impact of different initiatives. Take “Falls” for example. By investing 200 hours to prevent 15 falls, you will repay your investment plus preserve $20,560 of profit for your organization. Moreover, the calculator also puts that into context. The national average profit margin for hospitals is 3.4%. Revenue needed to equal that profit savings would be $604,705. (Note: The calculator allows you to plug in your facility’s actual profit margin.)
A tool like this can not only help justify a new software application, resource or initiative, it can also provide hard data on the financial outcomes of a PI project. By analyzing the pre- and post-initiative event volume in your patient safety event reporting application, you can validate to leadership that your team’s efforts extend beyond improving care.
Length of Stay (LOS) Calculator
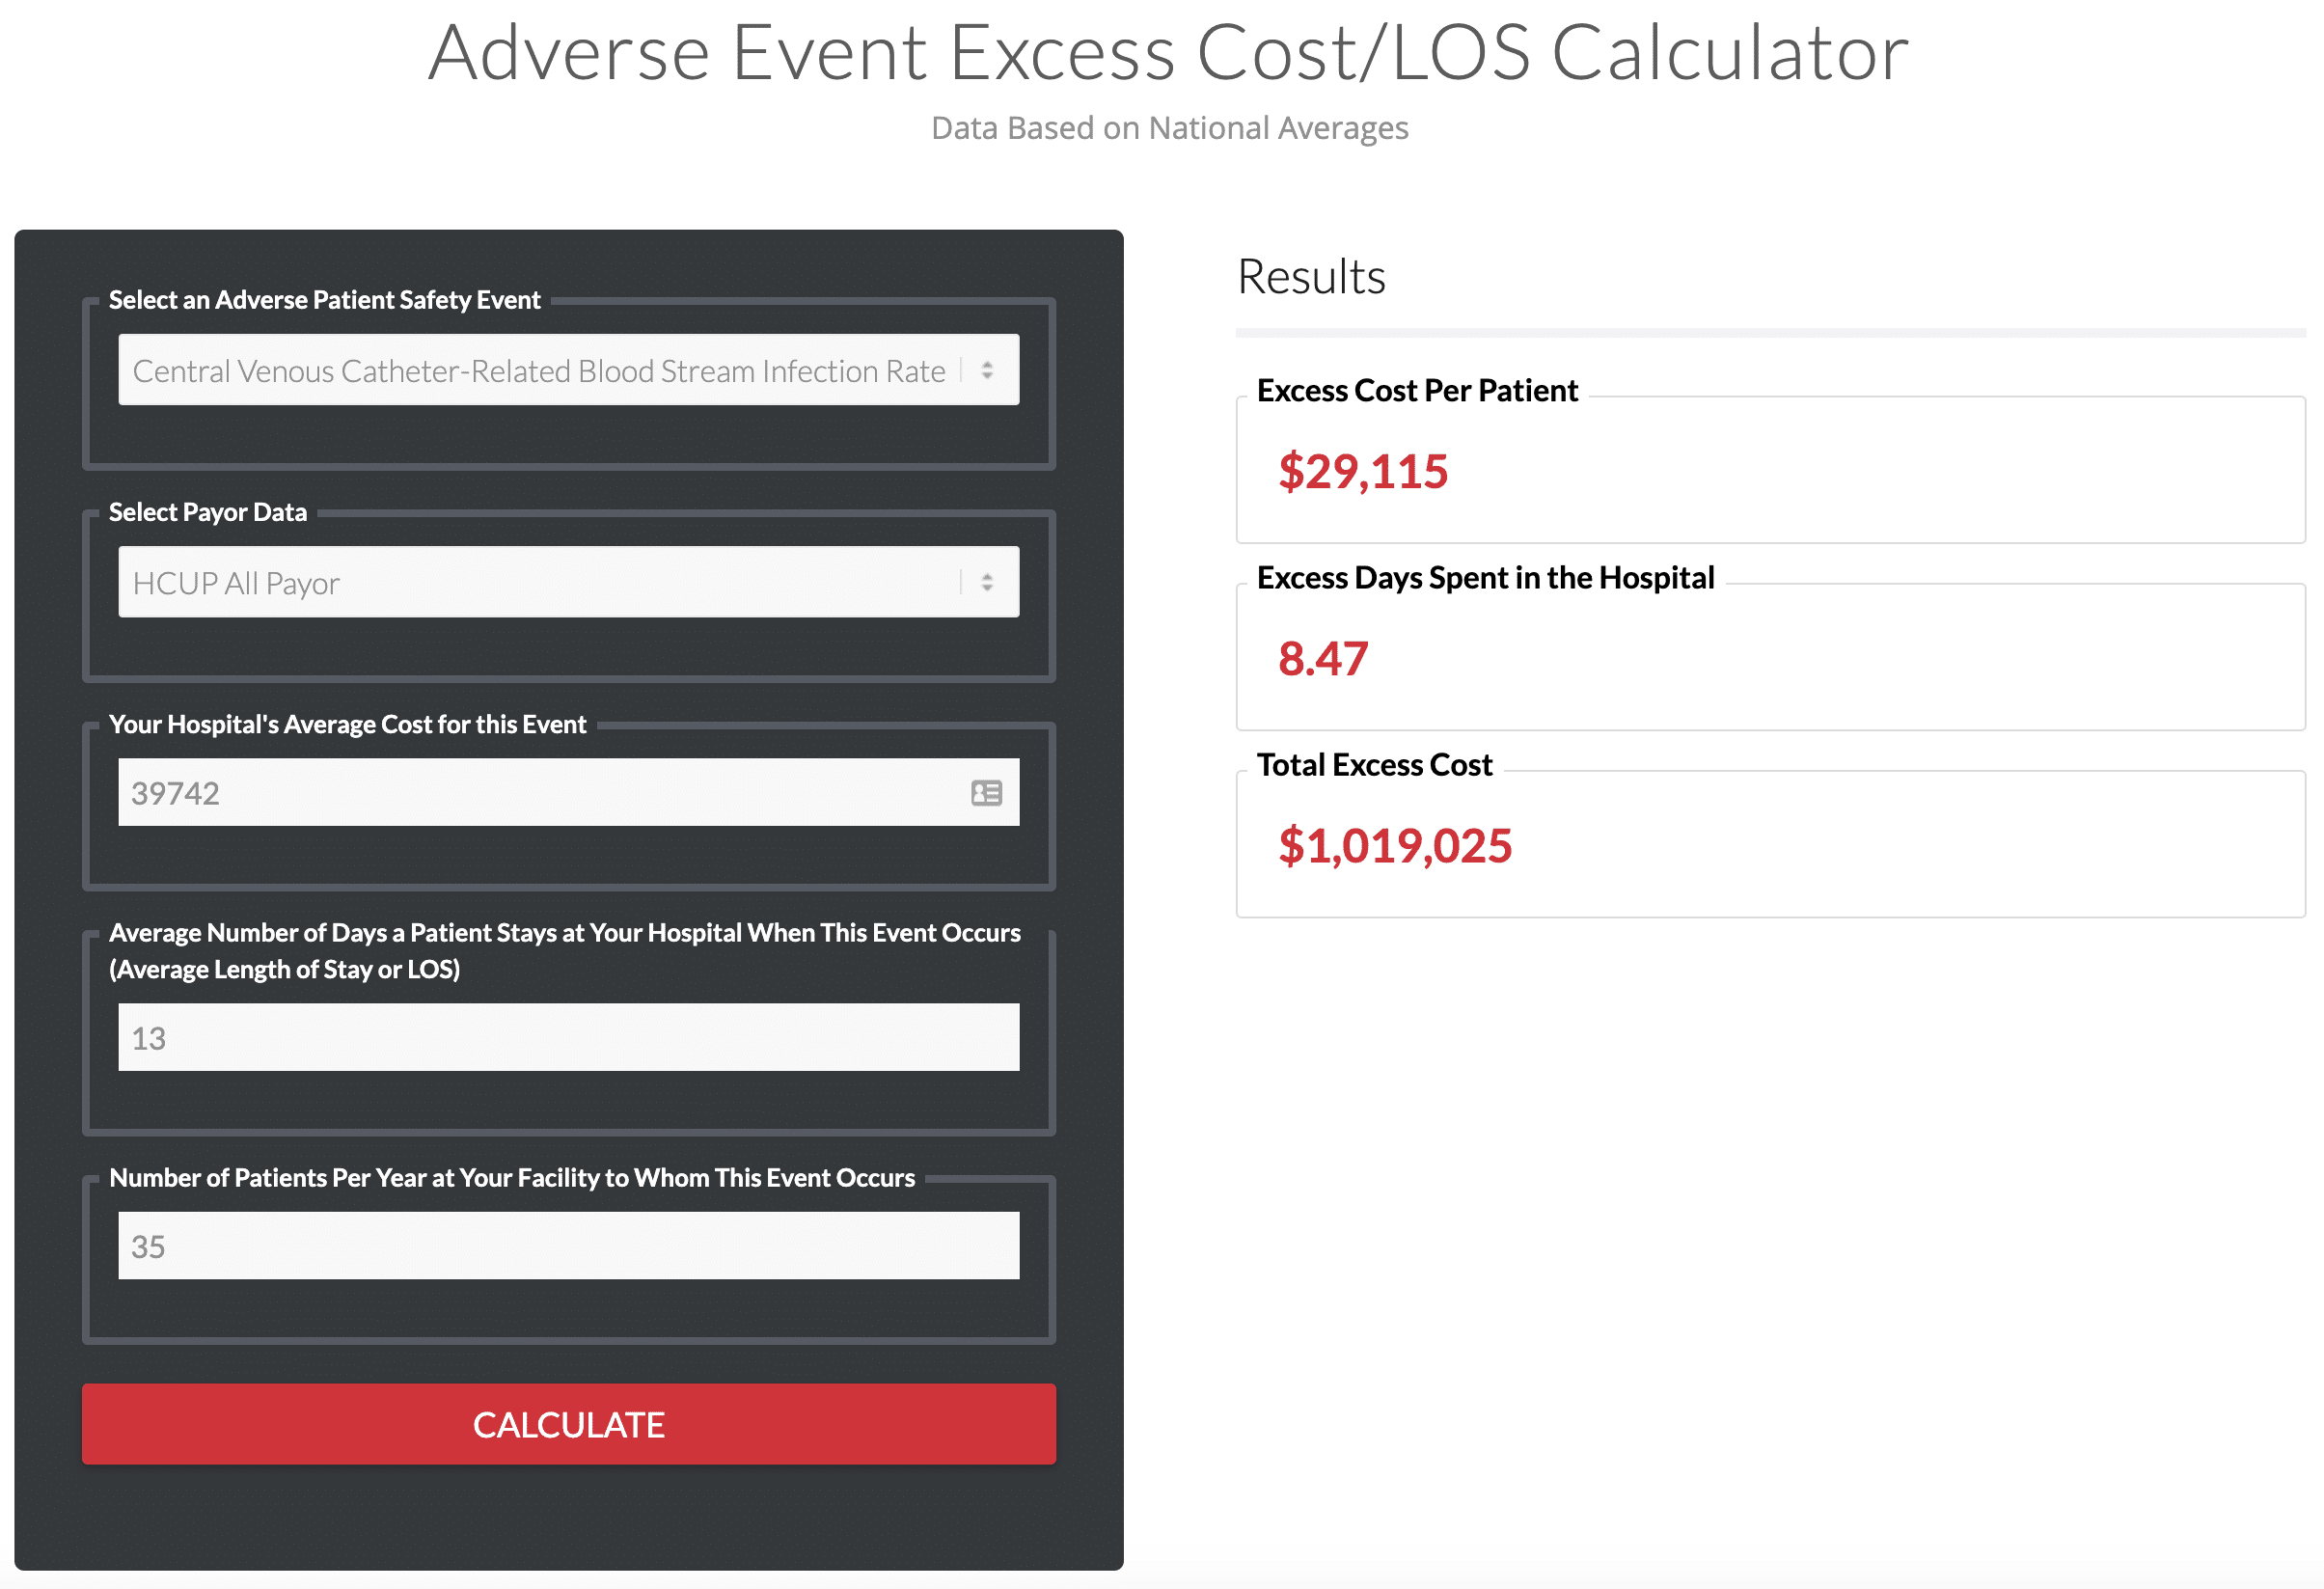
This Length of Stay (LOS) Calculator uses AHRQ’s PSIs to evaluate the financial impact of excess cost and Length of Stay per type of adverse event. ADN analysts evaluated ten types of events including pressure ulcers, catheter-related bloodstream infections (CLABSIs), respiratory failure, sepsis, and more. Analysts benchmarked data against the HCUP (Healthcare Cost and Utilization Project) All-Payer database (4+ million records representing 484 facilities) and CMS MEDPAR (Medicare Provider Analysis and Review) database (13+ million records representing 3,378 facilities). This free tool can assist facilities in quantifying their own excess cost and LOS for selected PSIs simply by entering a few figures related to their own volumes, costs, and lengths of stay.
Predictive Performance App
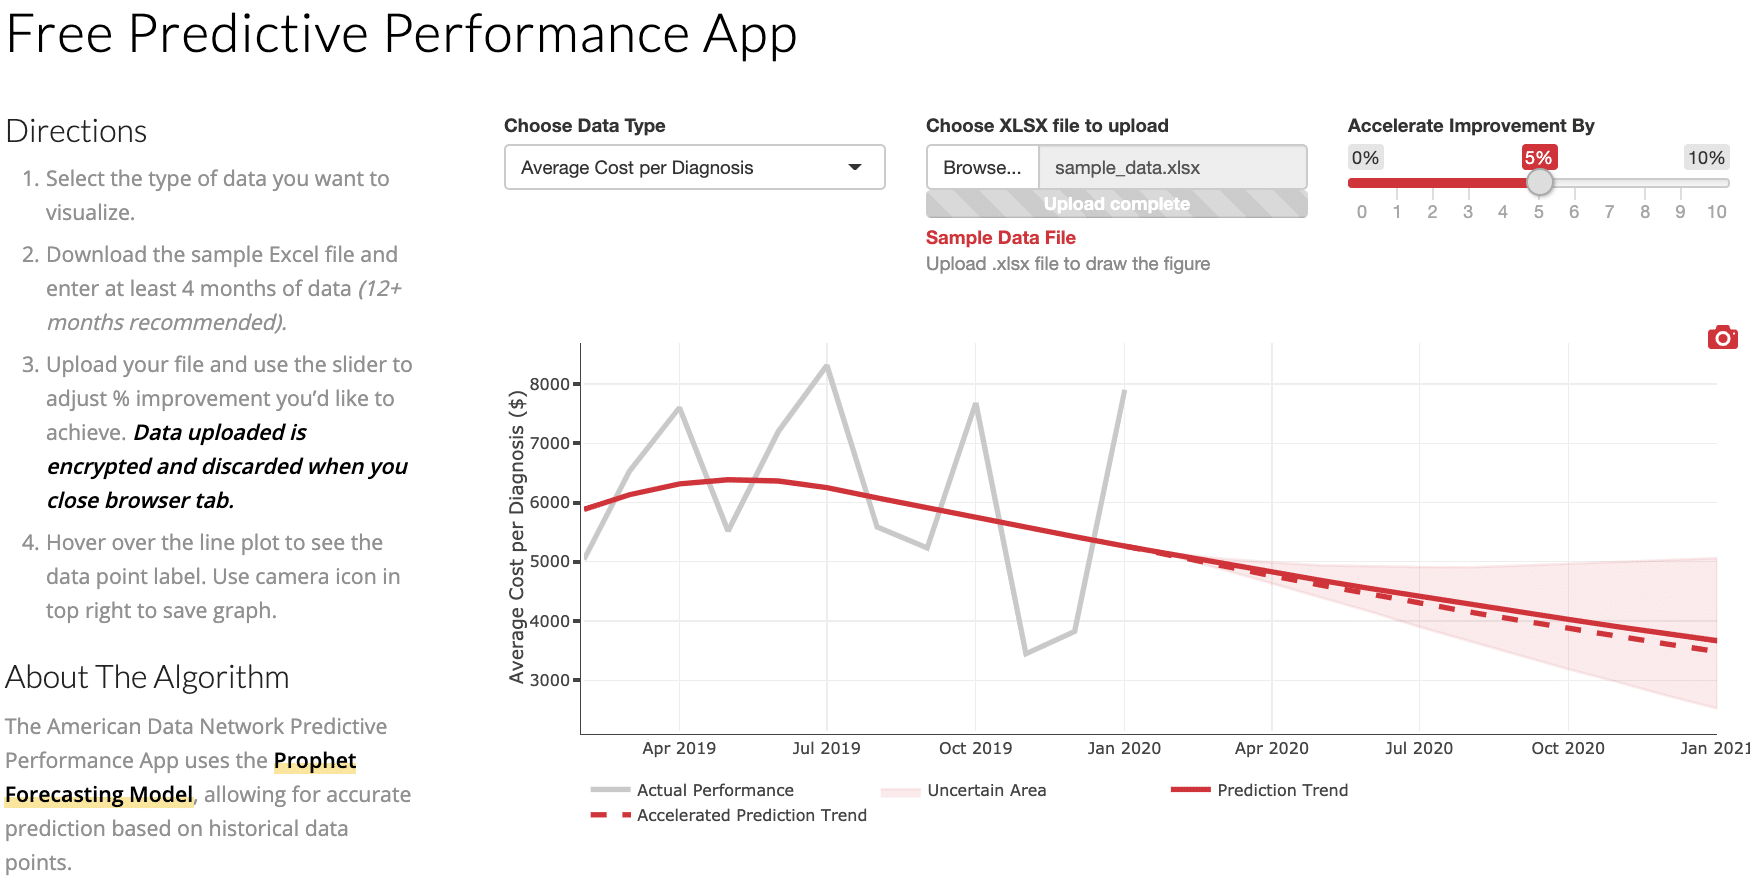
The free Predictive Performance App can forecast how improved performance will trend over time, using accurate predictions based on your historical data points. Analyze your Average Cost Per Diagnosis, Average Length of Stay, Complications, Core Measure Compliance, Readmission Rate, and Mortality Rate. This tool can be used to establish an “Events-to-Prevent Goal” for an initiative to ensure it has a neutral or positive financial impact on your organization.
The findings these tools quantify help hospitals target patient safety efforts in areas that can have the most significant effect. Healthcare quality and patient safety have enormous financial potential. But it’s up to quality and safety professionals to arm themselves with data to turn these opportunities into realities.

For more than 25 years, American Data Network (ADN), which is also the parent company to its Patient Safety Organization (ADNPSO), has worked with large data sets from various sources, aggregating and mining data to identify patterns, trends, and priorities within the clinical, financial, quality and patient safety arenas. ADN developed the Quality Assurance Communication (QAC) application, with which hospitals, clinics, rehabs, and other providers record and manage patient safety events. By entering events into ADN’s QAC application and submitting them to ADNPSO, information is federally protected and thereby privileged and confidential. These protections provide a safe harbor to learn from mistakes and improve patient safety.
Resources:
- Institute for Healthcare Improvement
http://www.ihi.org/communities/blogs/_layouts/15/ihi/community/blog/itemview.aspx?List=7d1126ec-8f63-4a3b-9926-c44ea3036813&ID=411
- Kohn, L. T., Corrigan, J., Donaldson, M. S., & James, B. (2000). To err is human: building a safer health system. Washington, D.C.: National Academy Press.


