Patient Safety Event
Reporting System
Patient Safety is complicated. Event Reporting doesn’t have to be. Our intuitive Patient Safety Event Reporting Application gives you all of the functionality you need with none of the clutter. You can report events, it has automated notifications, a task queue, and powerful interactive dashboards. But it’s not so overloaded that it isn’t affordable.
Simply put: our app makes it easy to identify trends and patterns in your data.
WHY IT MATTERS
The Urgency of Healthcare Incident Reporting
The realm of healthcare, by nature, demands a high standard of care and safety. However, it’s a complex field where errors can happen. Incident reporting in healthcare has become a critical aspect of maintaining high-quality patient care. The introduction of healthcare incident reporting software plays a vital role in managing these concerns.
Enhances Patient Safety
Aids in Good Catch Reporting
Facilitates Learning
case studies

How One Hospital Turned an Operational Transition into an Opportunity to Improve Patient Safety
THE OBJECTIVE
Goals for Event Reporting
The transformation from traditional manual incident reporting to digital systems has been significant. Incident reporting software healthcare systems, as a result, have emerged as game-changers. Some benefits include:
Ease of Reporting
It simplifies the process of reporting an incident. If an incident occurred, the healthcare provider can report it swiftly using a mobile-friendly, web-based application.
Effective Management
An incident management software ensures efficient reporting and management of healthcare events.
Improved Patient Care
The use of patient safety software aims to improve patient experiences and outcomes.
The transformation from traditional manual incident reporting to digital systems has been significant. Incident reporting software healthcare systems, as a result, have emerged as game-changers. Some benefits include:
Ease of Reporting
It simplifies the process of reporting an incident. If an incident occurred, the healthcare provider can report it swiftly using a mobile app.
Effective Management
An incident management software ensures efficient reporting and management of healthcare events.
Improved Patient Care
The use of patient safety software aims to improve patient experiences and outcomes.
The goal is to create a patient safety report that is effective and easily understood. That’s where a patient safety reporting system and safety incident reporting tool come into play. They help in:
Encouraging Reporting
These tools make event reporting in healthcare straightforward, prompting more people to report workplace incidents.
Ensuring Follow-up
Once a report is made, an incident reporting tool ensures it doesn’t get lost in the shuffle. Each report is followed up on, leading to improved health and safety measures.
The implementation of healthcare incident reporting systems is crucial in a health care setting. These systems provide a path to mitigate potential risks, improve patient care, and maintain a safe environment for all.
Product Summary
Patient Safety Product Features
Providing safe care to patients is a top priority, and organizations rely heavily on their Patient Safety Departments to gather data, identify trends about the types of incident reports in healthcare and implement error reduction and prevention plans. Most providers have a healthcare incident reporting process in place for tracking patient safety events. But many involve unnecessarily manual aspects that an application can automate. Moreover, these existing processes likely are not collecting all the vital data elements that shed light on key areas for improvement.
Helping your team step away from an existing process that’s comfortable can be a challenge but one that’s well worth it. A robust patient safety event reporting application can be a transformational game-changer to your organization’s goal of delivering safer care.
Event Collection
Event Management
Event Analytics

Event Collection
- Intelligent, Dynamic Event Submission Form
- Auto-Populated Patient Data
- Incident, Near Miss / Good Catch, & Unsafe Condition Tracking
- Customizable Subcategories
- File Attachments
Event Management
- Powerful Work Queue
- Automated Notifications and Task Assignment Functionality
- Sort and Filter to Prioritize Events
- Accelerate Event Discovery Time
- Reduce Risk with Federal PSO Protections
Event Analytics
- Powerful Interactive Dashboards
- Proprietary Event Subcategories
- Easy Data Exporting
Event Collection
Event Collection
- Intelligent, Dynamic Event Submission Form
- Auto-Populated Patient Data
- Incident, Near Miss / Good Catch, & Unsafe Condition Tracking
- Customizable Subcategories
- File Attachments
Event Management
Event Management
- Powerful Work Queue
- Automated Notifications and Task Assignment Functionality
- Sort and Filter to Prioritize Events
- Accelerate Event Discovery Time
- Reduce Risk with Federal PSO Protections
Event Analytics
Event Analytics
- Powerful Interactive Dashboards
- Proprietary Event Subcategories
- Easy Data Exporting
1. Collect Event Data
-
Intuitive
Event
Collection -
Auto-Populated
Patient
data -
Capture
More Than
Incidentts -
Customizable
Subcategories -
File:
Attachments

Intuitive Event Collection
As a web-based system, rollout is as easy as installing a desktop shortcut to our secure app. With built in dynamic and intelligent form logic, our patient safety event reporting application guides frontline staff through a form submission, only requiring the fields necessary to that incident, near miss, or unsafe condition.

Auto-Populated Patient Data
Our application easily connects to your Admit and Discharge Transfer (ADT) feed. When submitting a form, staff only need to fill in the Encounter ID. Then the patient’s name, age, admission date, and many other fields are pre-populated with the correct data. Not only does this save time, but it reduces the chance for human error.

Capture More than Incidents
Many event reporting processes focus primarily on incidents that reach the patient. However, near misses and unsafe conditions can reveal fractured systems and processes that lead to errors. Focusing primarily on incidents forces staff into a reactive posture, rushing to diagnose and fix what has already happened. Many quality-leading organizations are striving for a more proactive focus by concentrating on near misses and unsafe conditions.

We understand that not all patient safety events may fit neatly into a defined AHRQ Common Format Event Type (e.g., Fall, Medication). ADN has created Other Subcategories to help you characterize these events. Our application allows acute care facilities to edit existing subcategories to better clarify their purpose. Additionally, add custom subcategories to separately capture and monitor facility-specific event types. This feature ensures your facility captures all the data you need, exactly the way you need it.

Capturing as much information about a patient safety event is critical to diagnosing fractured systems and processes. The Attachment feature allows you to attach, store, and view supplemental docs related to an event in most file types. This provides your facility with an option for secure storage and easy organization and retrieval.
2. Coordinate & Investigate Event.
-
Powerful
Work Queue -
Notification
& Task
Assignment -
Sort & Filter
Events -
Get Data
Faster -
PSO Risk
Protection

Anyone who truly understands the daily work life of a director or manager in patient safety or risk knows one thing for certain: They wear a LOT of hats. Time is not a luxury in their world. That’s why we built the work queue with exactly that in mind.

Our event reporting application automates many processes for you. When an event occurs, you and other designated managers will receive email notifications instantly. With a couple of clicks, you can assign it to one or more staff members for follow-up investigation. As the event ages, reminder emails will automatically nudge the assigned investigators to ensure timely completion.

With the ability to sort and filter your work queue, you can easily ensure you’re always working top priority events first, such as those with a higher level of harm.

Other hospitals we’ve worked with that transitioned from a paper process complained that their prior process was very manual and scattered. They felt lucky if they even learned about the events that happened. Our tool helped make their incident reporting process more efficient, including real-time event notifications. It removes the lag time between when an event occurs and when you learn about it. Plus you get access to real-time analytics dashboards without the need for manual data entry and manual report production, which wastes valuable clinical resources and introduces the opportunity for error. Our application frees you up to spend time working on improvement initiatives instead of collecting and aggregating event data for manually built reports.
By partnering with us, you will reduce risk because we’re a listed Patient Safety Organization. So as an added bonus you get free access to the federal protections and knowledge sharing from our PSO.
3. Aggregate & Analyze Your Data
-
Interactive
Dashboards -
Proprietary
Subcategories -
Eazy Data
Exports

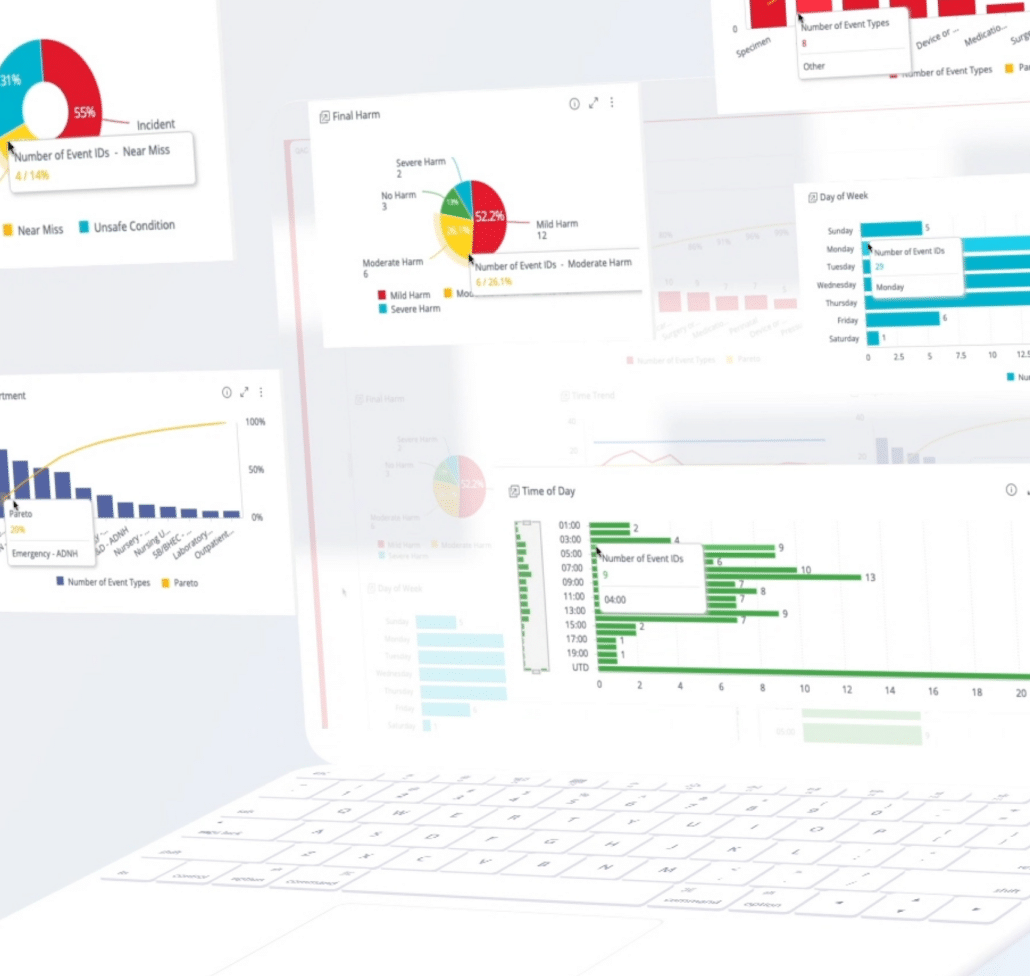
The Quality Assurance Communication Event Reporting System includes powerful interactive dashboards that make it easier than ever to visualize and interpret your patient safety data. This feature combines all of the key reports you depend on into one place to streamline your workflow.
Save Time with Smart Filters
Our application’s filtering functionality updates your dashboard instantly, giving you the ability to quickly separate events by different criteria combinations on the fly as you slice and dice your data. Plus, you can save default filters so the data you analyze most often is ready and waiting when you log in. All dashboards are tailored to each user’s role within your organization, making it easier to engage your department and event managers and empower them to conduct their own analysis and take ownership of their department’s patient safety data.
Drill Down without Leaving the Dashboard
The layout of each dashboard is designed to provide a quick and concise overview of your event data. But drilling down is easier than ever and can be done by clicking within any graph, which will apply your selections to the entire dashboard.
Delve Deeper with Event Type Dashboards
The Event Type Dashboards allow you to easily scrutinize your event-specific data in one, combined view making it easier to identify correlations. For example, the Fall Dashboard breaks down falls by age, types of injury, risk factors, activities prior to fall, interventions, contributing medications, and more.
Share Insights with Easy Graph Exporting
Just as important to your independent analysis is your ability to share it with your team and leadership. In a matter of seconds, you can easily export an image or PDF of any dashboard graph to be able to share it in a meeting or presentation.

As a Patient Safety Organization, our team conducted a deep dive analysis of 4 years of data and determined that events categorized as “Other” accounted for over 40% of all the submitted patient safety events, a trend other PSOs around the country are also finding. Thus, our team developed a proprietary list of 33 subcategories, which allows providers to better isolate and understand the types of events that do not fit neatly within the Common Formats developed by the Agency for Healthcare Research & Quality. The subcategories that we developed from our intensive analysis sparked a national conversation with other organizations wanting to follow suit. Our team was even invited to present on the subcategory analysis findings at the National Association for Healthcare Quality Conference.

Easily Export Your Data Whenever You Want
At American Data Network, we believe your data is just that — YOUR data. Unlike some vendors, we don’t charge you to export your data. From our event reporting application, you can easily export to CSV, XLS, PDF, or XML whenever you need.
the adn difference
Why partner with us?
By being both flexible and affordable, our patient safety event reporting tool suits hospitals large and small, clinics, and more.
Many providers reluctantly remain with their outdated paper-based or in-house built processes because most patient safety event reporting solutions are unaffordable. We believe all providers should have access to the ability to make the best use of their patient safety data. That’s why we built an application suitable and affordable for a facility of ANY size.
More than 10 years ago, several of our clients approached us with a problem. None of the patient safety event reporting solutions on the market were acceptable. So we worked hand-in-hand with them to develop an incident reporting system that truly suited their needs. Since then, we’ve remained dedicated to keeping clients and their feedback top of mind for all our enhancements, ensuring the application remains the solution to all your actual event reporting problems.
Frontline Staff
Events are reported by staff on the front lines. No user accounts needed. Plus, with the ability to allow anonymous event submissions, you’ll get insight into previously hidden unsafe conditions while promoting the growth of your Just Culture. While approximately 80% of users self-identify, the anonymous option helps reveal a notable portion of safety issues that could have remained unknown.
Managers
Our application allows for event and department manager user roles. This enables your leaders to manage the events specific to their role and/or department. In addition to being able to coordinate the follow-up investigations of events, our application empowers them to conduct their own analysis and take ownership of their department’s patient safety data. Perhaps a time of day report reveals a large portion of falls occurs during the hours associated with shift change. With the ability to better analyze their own department, managers can come to patient safety meetings prepared with the team’s performance as well as improvement recommendations.
Directors and Senior Leaders
With the ability to generate all the necessary risk and patient safety incident reports literally in a few clicks, preparing for senior leadership meetings is a breeze. Not only do you have the pulse of your facility’s safety always at your fingertips, but you will be better equipped to set strategic goals and priorities.
“ADN’s Quality Assurance Communication application has proven to be a much more superior tool than the event reporting functionality contained within our electronic medical record system. I have instant access to a multitude of reports and feel like I have a better handle on which patient safety issues we really need to be focusing on in our facilities. ADN’s QAC tool is reliable, and it simplifies the job of managing the range of events that can happen across a system.”

Corporate Director, Quality Resources
Conway Regional Medical Center
Get In Touch With Us
Contact Sales
Contact Support
Are you an existing customer looking for help with a particular issue?
Or give us a call at (501) 225-5533, we love helping customers.
Resources
Our Products
Our Services
Get In Touch
10809 Executive Center Drive
Searcy Building, Suite 300
Little Rock, AR 72211
(501) 225-5533
(501) 222-1083 Fax