What are Specimen Errors?
Specimen Errors refer to any defects that occurs during the entire testing process – from ordering tests to reporting results – that affect the quality or safety of laboratory services. Tracking specimen errors to identify problems in the process is critical to patient safety as they can lead to injuries, misdiagnoses, and delayed or unnecessary treatments.
Table of Contents
Summary of The Specimen Errors Study
The American Data Network Patient Safety Organization (ADNPSO) analyzed 4 years of data and found that specimen errors consistently ranked among its highest-reported safety incidents, with 73.7% of the events deemed preventable. This led ADNPSO to develop and launch a 9-month Specimen Focused Study aimed at better understanding why these events happen and how to reduce errors across all stages of the Specimen Processes: Pre-analytical, Analytical and Post-analytical.
ADNPSO collaborated with Patient Safety and Laboratory experts to create a specimen data collection form and recruited PSO members to join the study. In partnership with the 15 acute care participants, ADNPSO performed aggregate data analysis, hosted learning sessions to discuss findings, guided Rapid Cycle PDSAs, and developed detailed Process/Cause Mappings to galvanize improvement activities.
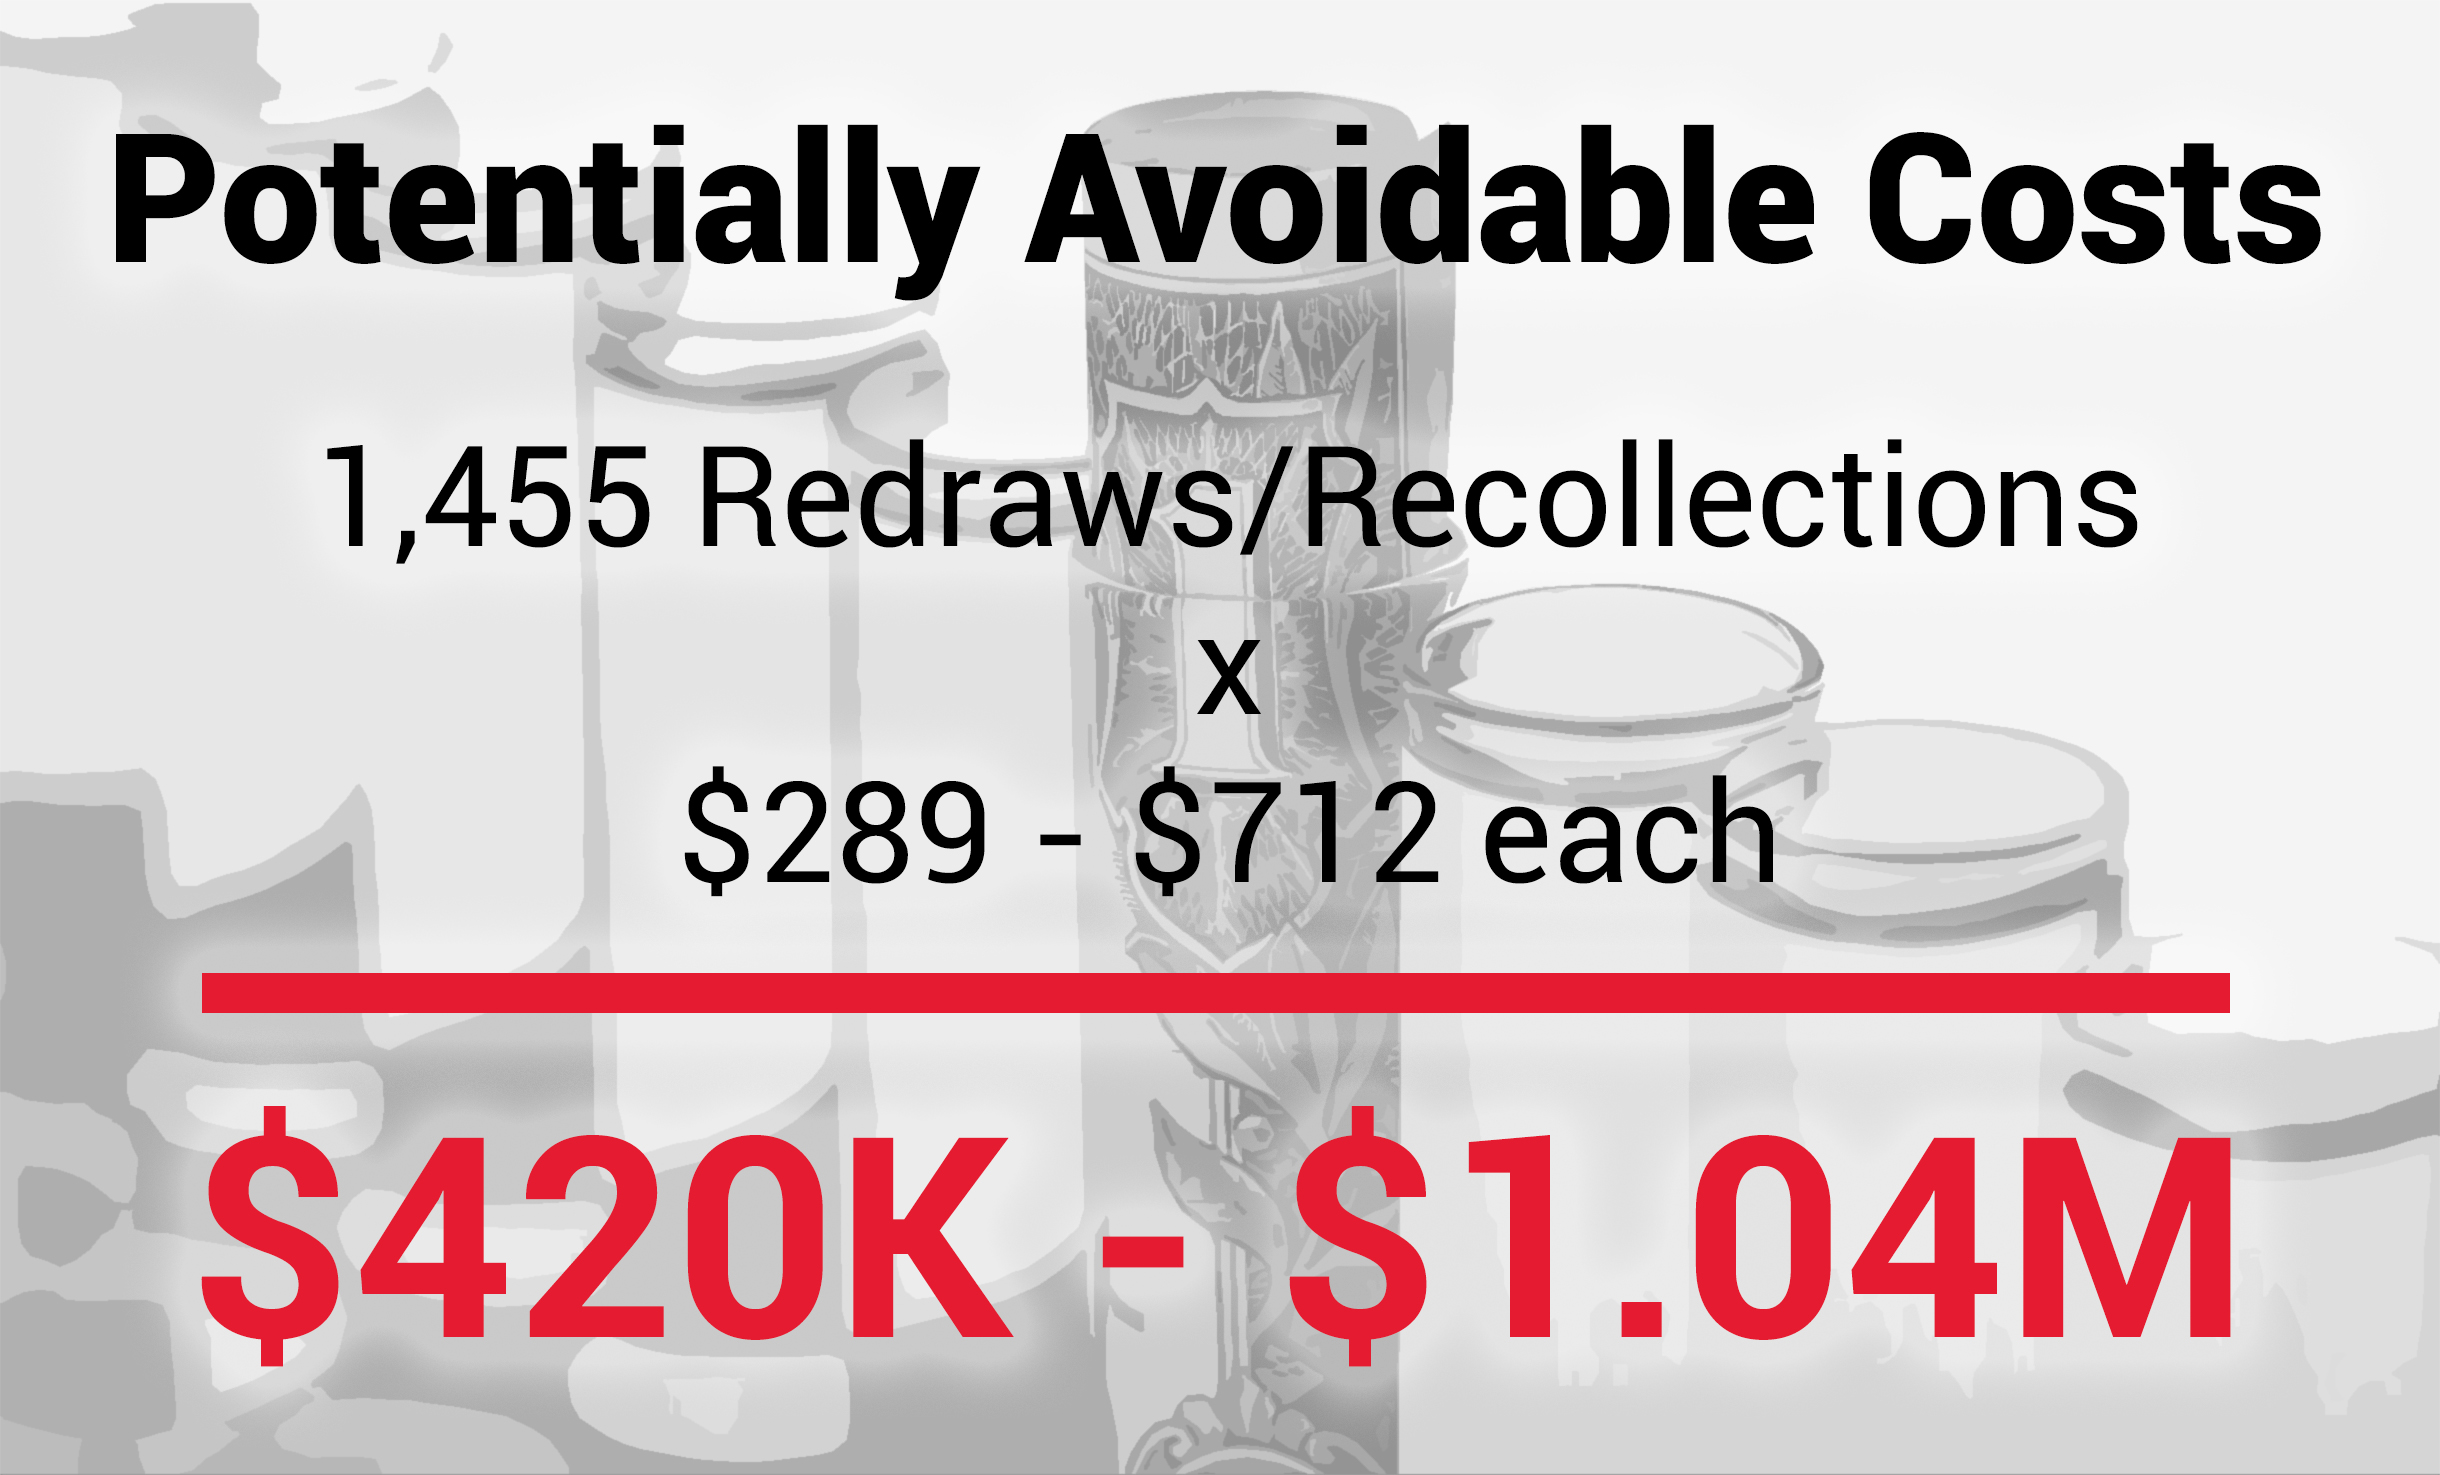
Among other successes, ADNPSO participants saw a 147% increase in specimen event reporting during the study. The potential avoidable costs were estimated at $420K to $1.04M over just 9 months, reflecting the significant impact of reducing specimen errors on both patient safety and hospital efficiency. Hospitals can also use the specimen error toolkit to continue reducing these incidents.

Background on Specimen Errors in Patient Safety
Every year, the American Data Network Patient Safety Organization (ADNPSO) identifies strategic initiatives to collaborate on with its members, driven by data and best practices from healthcare literature. In 2024, recognizing that Other Event Types often serve as a catchall for errors not easily categorizes in standardized forms, ADNPSO introduced Other Subcategories. This allowed for better aggregation and tracking of specific incident types, such as specimen errors, which quickly emerged as one of the most frequently reported subcategories during a 4 year analysis.
Healthcare literature supported ADNPSO’s internal findings of specimen error prevalence, and verified the complexity and risks associated with laboratory processes. Further affirmation for this focused study include:
- 60% – 70% of medical decisions are based on laboratory results.
- The majority of errors occur in the Pre-analytical Phase.
- Post-analytical errors most often result in major patient harm.
- Redraws and recollections contribute to financial waste and patient dissatisfaction.
- The majority of these errors are preventable.
A large percentage of medical decisions, if not most, are based on laboratory results. These decisions are dependent on the normals, abnormals, and critical values. This requires collaboration, coordination and communication across multiple disciplines to ensure specimens are correctly ordered, collected, tested and interpreted, resulted, and acted upon in a timely manner.
The primary goal of ADNPSO’s Specimen Focused Study was to establish baseline performance and quantify the potential for reducing high-volume/high-risk specimen errors. To accomplish this goal, ADNPSO was committed to:
- Better understand the causation of specimen errors through data collection and analysis occurring in Pre-analytical, Analytical and Post-analytical Phases.
- Promote collaboration among participants via learning sessions with federal protections.
- Develop recommendations for best-practice patient safety activities.
As a first step, ADNPSO adopted the following literature-based definition of specimen errors: “Any defect that occurs during the entire testing process, from ordering tests to reporting results, and in any way influences the quality/safety of laboratory services” (Goldschmidt 1995). This definition guided the study’s approach and goals.
In July 2018, ADNPSO successfully recruited 15 acute care facilities across Arkansas, leveraging relationships built through its successful 2017 Good Catch Campaign. ADNPSO also collaborated with lab directors to develop a new Specimen Collection Form. Participating hospitals were encouraged to provide internal education on the new Specimen Form to prepare for the November 1, 2018, start date.
ADNPSO hosted a Kickoff Webinar in September 2018 to outline the study’s objectives. ADNPSO provided tools and held Working and Outcome Learning Sessions in March and September 2019. The study was structured around two data analytic phases over nine months.
- The first 90 days (Nov 2018 – Jan 2019) were dedicated to establishing baseline data. ADNPSO analyzed this data and led collaborative discussions to identify improvement opportunities.
- The following 90 days focused on problem identification and initiation of Rapid Cycle PDSA (Plan-Do-Study-Act). Participants returned to their facilities, engaged subject matter experts and strengthened the internal plans.
- The final 90 days were used to collect post-implementation data and measure the effectiveness of the corrective actions.
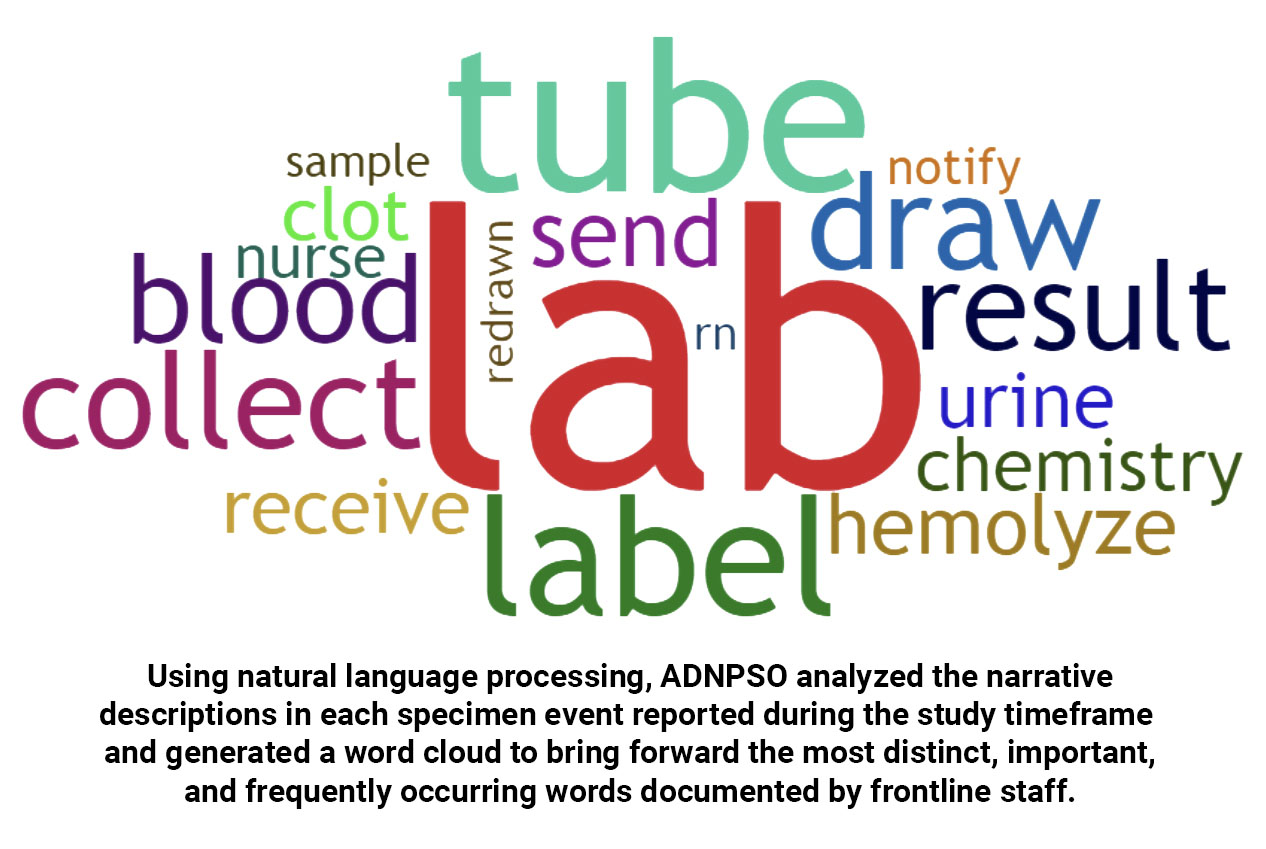
ADNPSO Specimen Study Deep Dive
The graph below shows the study timeframe and associated volumes. The reporting process was stable across the study, with an average of 264 specimen errors reported each month during the nine months of data collection.
The graph below shows the patient age distribution within the study. While Adults 18-64 years old represent almost half (47.26%) of the specimen events reported, it is followed by Older Adults > 65 years old at 38.95%. This was noteworthy as this population is more vulnerable and may incur more serious outcomes following specimen errors, such as delayed results and/or inappropriate treatments.
Another vulnerable population is Neonates 0-28 days old, which account for 11.38% of all specimen events reported during the study timeframe. A comprehensive review of these revealed the majority of the errors were associated with the mother’s label affixed to the neonate’s specimen. Strict adherence to best-practice labeling techniques at the crib side is crucial to mitigating the risk for neonatal harm. Implementing strategies from the national patient safety goals guide can help mitigate these risks.
ADNPSO’s data collection form was designed to capture the Specimen Source. Data revealed 65.7% of all reported errors involved Venous Blood, followed by Urine at 11.56%, and Other at 10.97%. Examples categorized as Other included Cord Blood, Various Swab Samples, and Surgical/Procedural Aspirations.
The specimen errors data was also stratified by Collector Discipline, revealing Nursing as the primary collector at 60.11%, followed by Phlebotomists at 24.13% and Unknown at 8.07%. Of note, ADNPSO delved deeper into Unknown Collectors and found the missing information resulted from incomplete specimen labels. Enhancing labeling practices and staff training in this area could significantly reduce specimen errors across facilities.
Finally, in reviewing the data by Specimen Stages, ADNPSO found that the vast majority of events (89.99%) occurred within the Pre-analytical Phase, or before ever reaching the Laboratory. Analytical Phase events accounted for 4.29% and the Post-analytical Phase for 4.04%. Note, the Specimen Stage was reported as Unknown for 1.68% of events.
Preventability & Known Contributing Factors in Specimen Errors
In ADN’s patient safety event reporting system, one or more subject matter experts complete a follow-up investigation form to address the preventability of each specimen error incident. The graph below presents data for Specimen Incident Preventability by Study Phase.
At the start of the study, ADNPSO noted that 44.72% of subject matter experts selected were answering “Unknown” for Specimen Incident Preventability. To address this, ADNPSO raised the issue during the Baseline Analytic Learning Session in March 2019, urging hospitals to educate their staff on how to categorize preventability accurately. As seen in the graph above, this initiative was effective as there was a major decrease in “Unknown” when comparing across study phases. More specifically, “Unknown” responses had decreased from 44.72% to 7.49% by the end of the study, demonstrating increased accountability among investigators in assessing specimen errors.
ADN’s follow-up investigation form also gathers input from subject matter experts on known factors contributing to specimen errors and captures recommendations to prevent recurrence. The top contributing factors were:
- Inattention: Responsible for 30.77% of incidents.
- Communication Gaps: Linked to 14.14% of errors.
- Training Deficiencies: Accounted for 12.13% of incidents.
The highest-ranking Recommended Actions for aggregate data include Education/Training at 40.97%, followed by No Action Recommended at 37.02% and Other at 20.72%. ADNPSO discovered that during the baseline phase, over half of the specimen errors were marked as “No Action Recommended,” which conflicted with the preventability data for the same period. This discrepancy was discussed in the March 2019 Learning Session, prompting hospitals to reconsider their recommendations and implement more proactive corrective actions.
By the end of the study, the number of No Action Recommended responses had markedly declined when comparing the Baseline to the Post-implementation Phases. This positive outcome highlights an increased commitment among investigators to take stronger steps toward preventing future specimen errors.
Putting the Data Into Practice
Throughout the study, ADNPSO analyzed the submitted specimen events to identify trends and opportunities for improvement. To facilitate these improvements, ADNPSO hosted two in-person Learning Sessions – one in March 2019 and the other in September 2019. The first Learning Session presented aggregate baseline data findings to the participating hospitals. Each attendee was equipped with their hospital-specific data and PSO comparisons to identify priority areas of focus. ADNPSO used Process Mapping to guide participants in designing and implementing action plans through the remainder of the study.
Specimen Process & Risk for Errors
Lab Results – every patient needs them and every clinician wants them. Consider the number of steps and the number of hands involved between the Ordering and Resulting stages of the specimen process.

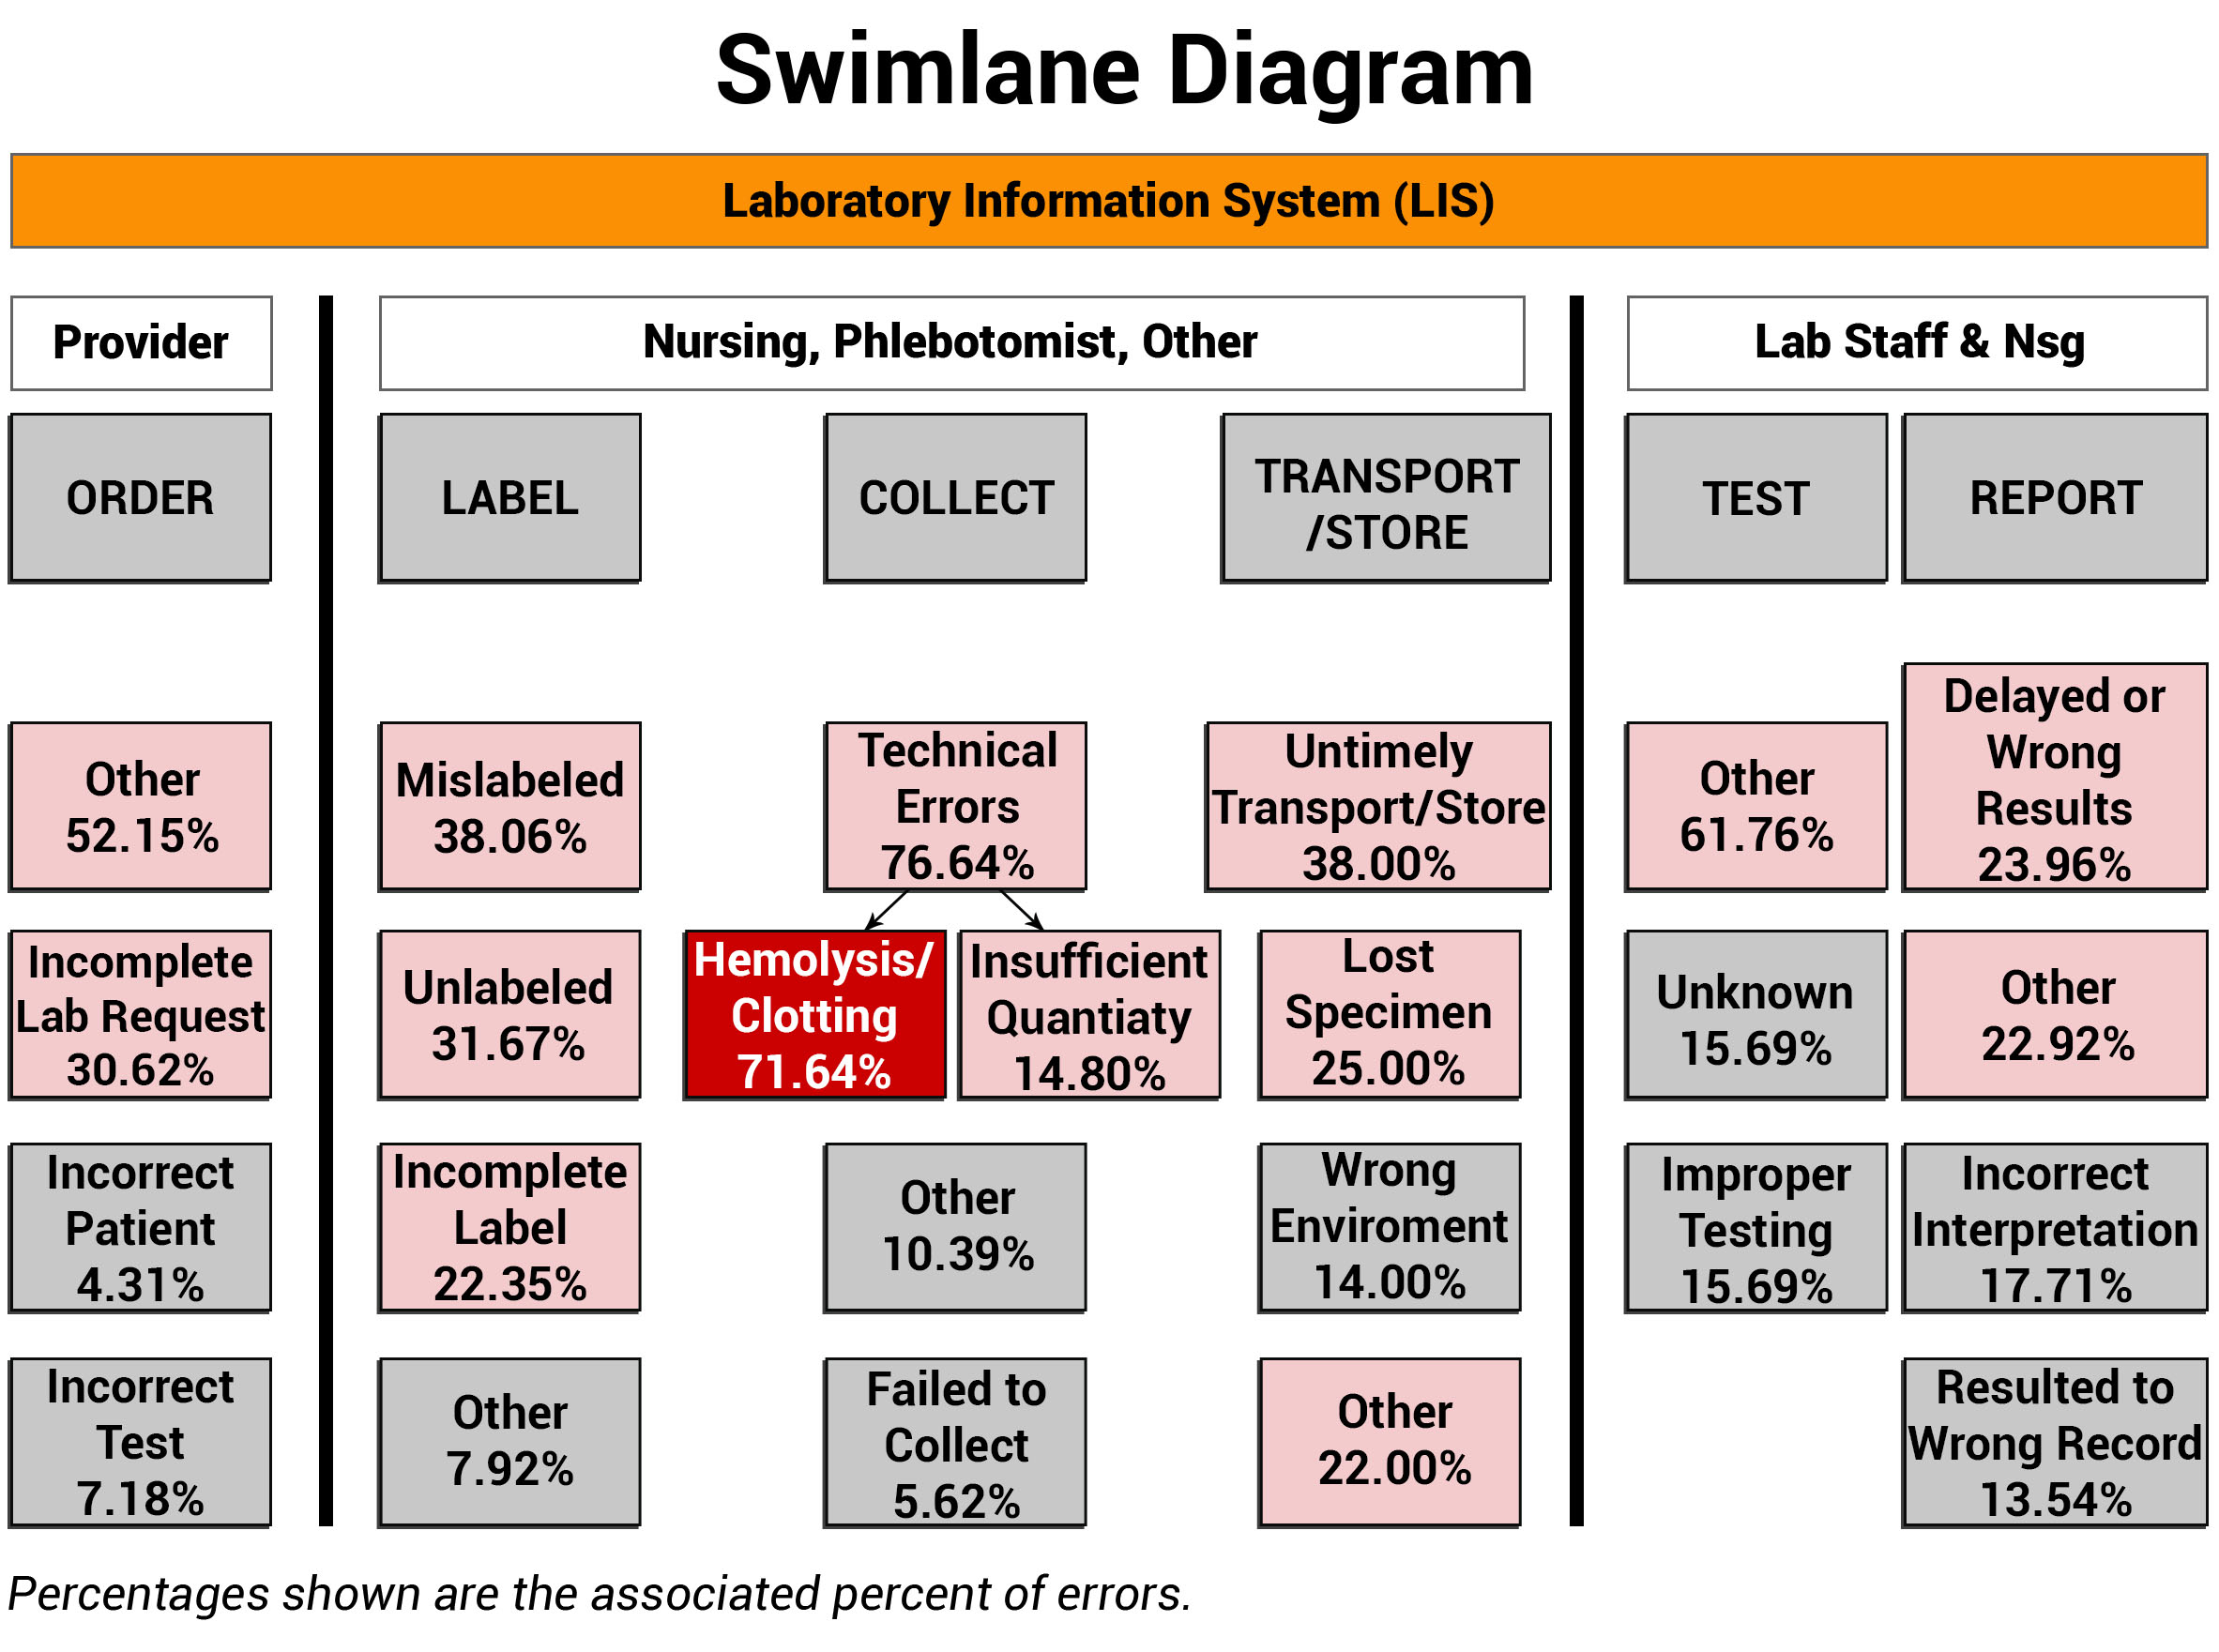
When examining any process, it is vital to identify and engage the disciplines involved, along with defining their roles and responsibilities. ADNPSO used Swimlane Mappings by Discipline and by Specimen Stages to help define ownership. In the Swimlane Diagram below, it is important to acknowledge the orange Laboratory Information System (LIS) bar that overarches all the swimlanes. The LIS plays an extensive role in all stages of the specimen process, impacting chain of custody, test requests, label generation, clinical worklists, test results, and report generation. The importance of the LIS is a recurring theme that is further explored in the Process and Cause Maps sections of this article.
Note that ADNPSO created swimlanes around the Specimen Stages and any involved disciplines. Then, the aggregated specimen data was applied to the corresponding swimlanes to visually link the relationships between the roles, stages and fractured process steps. The highest percentage errors are highlighted for attention and underscored the Collection Stage as a clear priority, and more specifically honed the focus on Hemolysis/Clotting at 71.64%. Because hemolysis happens while obtaining the specimen, the corrective actions can be targeted to the Nursing and Phlebotomy collectors.
When putting swimlane mappings into practice, organizations are encouraged to overlay their internal disciplines, stages and error data. Sharing this visual structure can act as a catalyst by increasing interdisciplinary awareness of the affected specimen process steps. Coupling this powerful data with a clear rationale for introducing change is key to propelling improvements.
A System Approach to Mapping the Specimen Process
ADNPSO collaborated with Patient Safety and Laboratory experts and referred to national standards to create Specimen Process Maps for each of the six stages: Ordering, Labeling, Collection, Transportation & Storage, Testing & Result Interpretation, and Result Communication. ADNPSO worked directly with cross-discipline teams from all participants to define the basic steps and desired outcomes for each stage. It is important to note when applying the Specimen Process Maps internally, each organization should engage involved disciplines, compare their internal workflows and tailor the maps as needed.
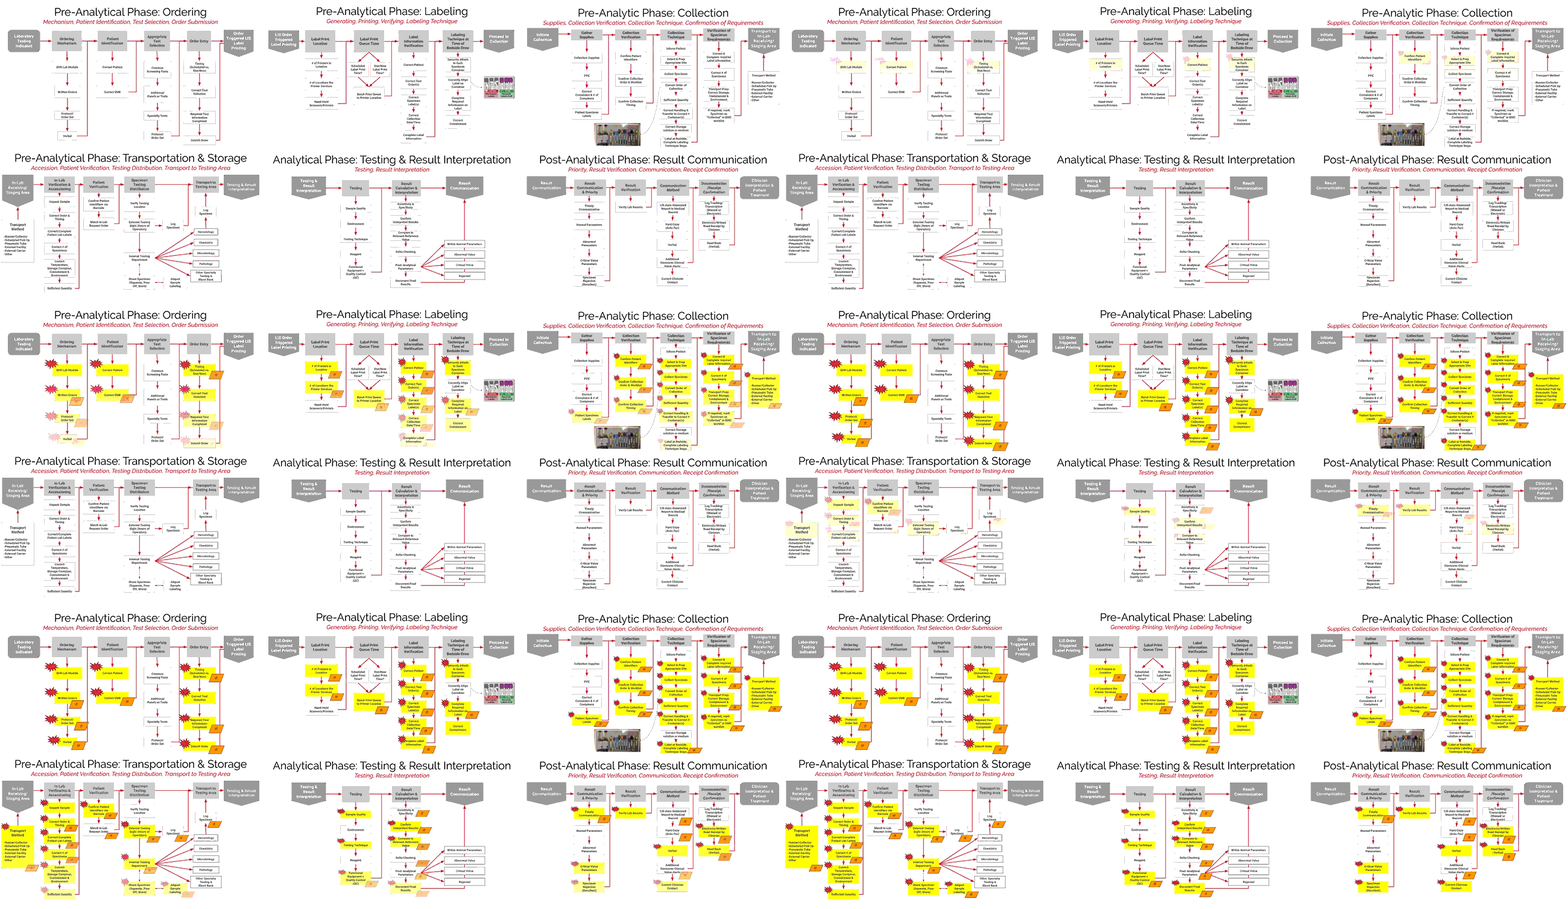
As seen in the images above, ADNPSO overlaid the aggregate data on the Specimen Process Maps to reveal and highlight the widespread system fractures. The next step was to examine the individual maps by Specimen Stage to pinpoint process vulnerabilities that require deeper investigation. Organizations using ADNPSO’s process maps are encouraged to overlay their specimen data in order to highlight error-prone steps for further analysis and advanced cause mapping. This approach can also be enhanced by incorporating tools from the specimen error toolkit for further analysis and advanced cause mapping.
Advanced Cause Mapping
With priority areas of focus identified using the Swimlane Mappings and Process Maps, ADNPSO used the Cause Mapping Method to further analyze and document the specimen errors. The template below served as a visual aid and tool for uncovering why errors occurred and better informing the subsequent corrective action plans.
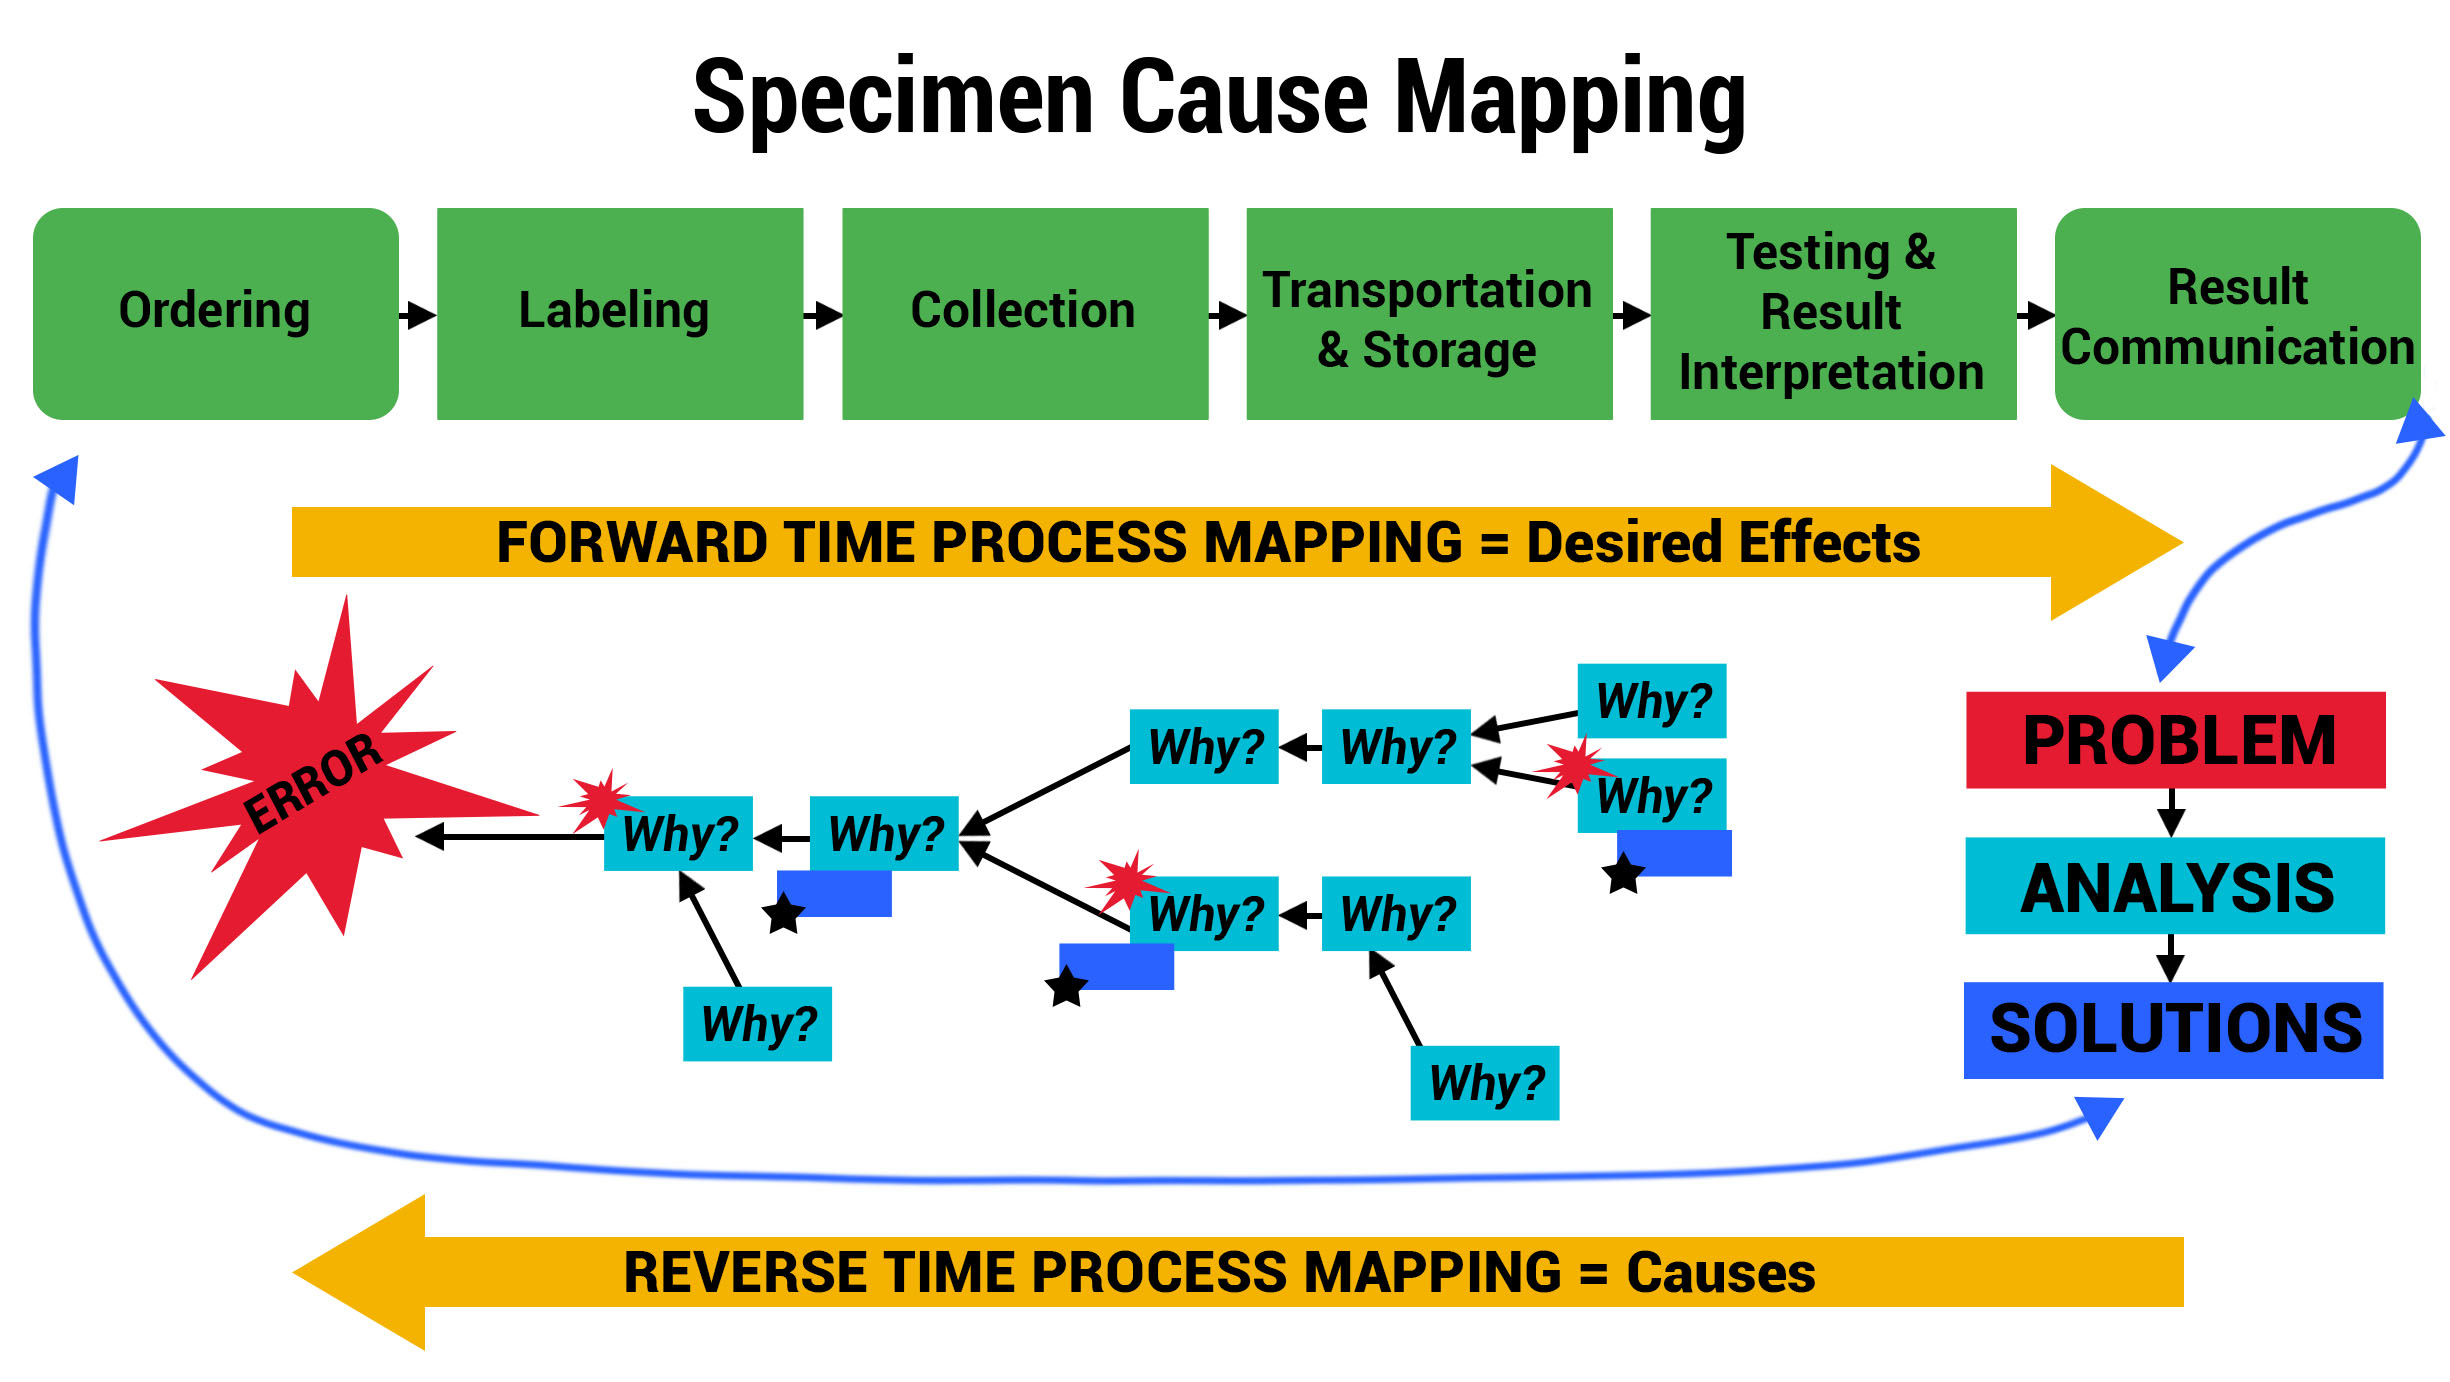
To demonstrate the power of these tools collectively, review the example below for the Specimen Labeling Stage, which affected 32.91% of all reported errors during the study. The 3 images below illustrate ADNPSO’s approach to dissecting the aggregate data and associated process steps to identify cause-and-effect relationships.

This approach also guided ADNPSO’s study participants, who followed our recommendations and enlisted internal subject matter experts when defining cause-and-effect relationships. Each participating organization submitted their cause maps and corrective action plans to ADNPSO on or before May 1, 2019 so that the impact could be measured during the study’s Post-Implementation Phase. In the next section, ADNPSO shares some of the successes realized by study participants employing rapid-cycle improvement strategies.
Rapid Cycle PSDA: Real-World Improvements
Outcome 1: LIS Change Improves Workflow for “Now” Order Draws
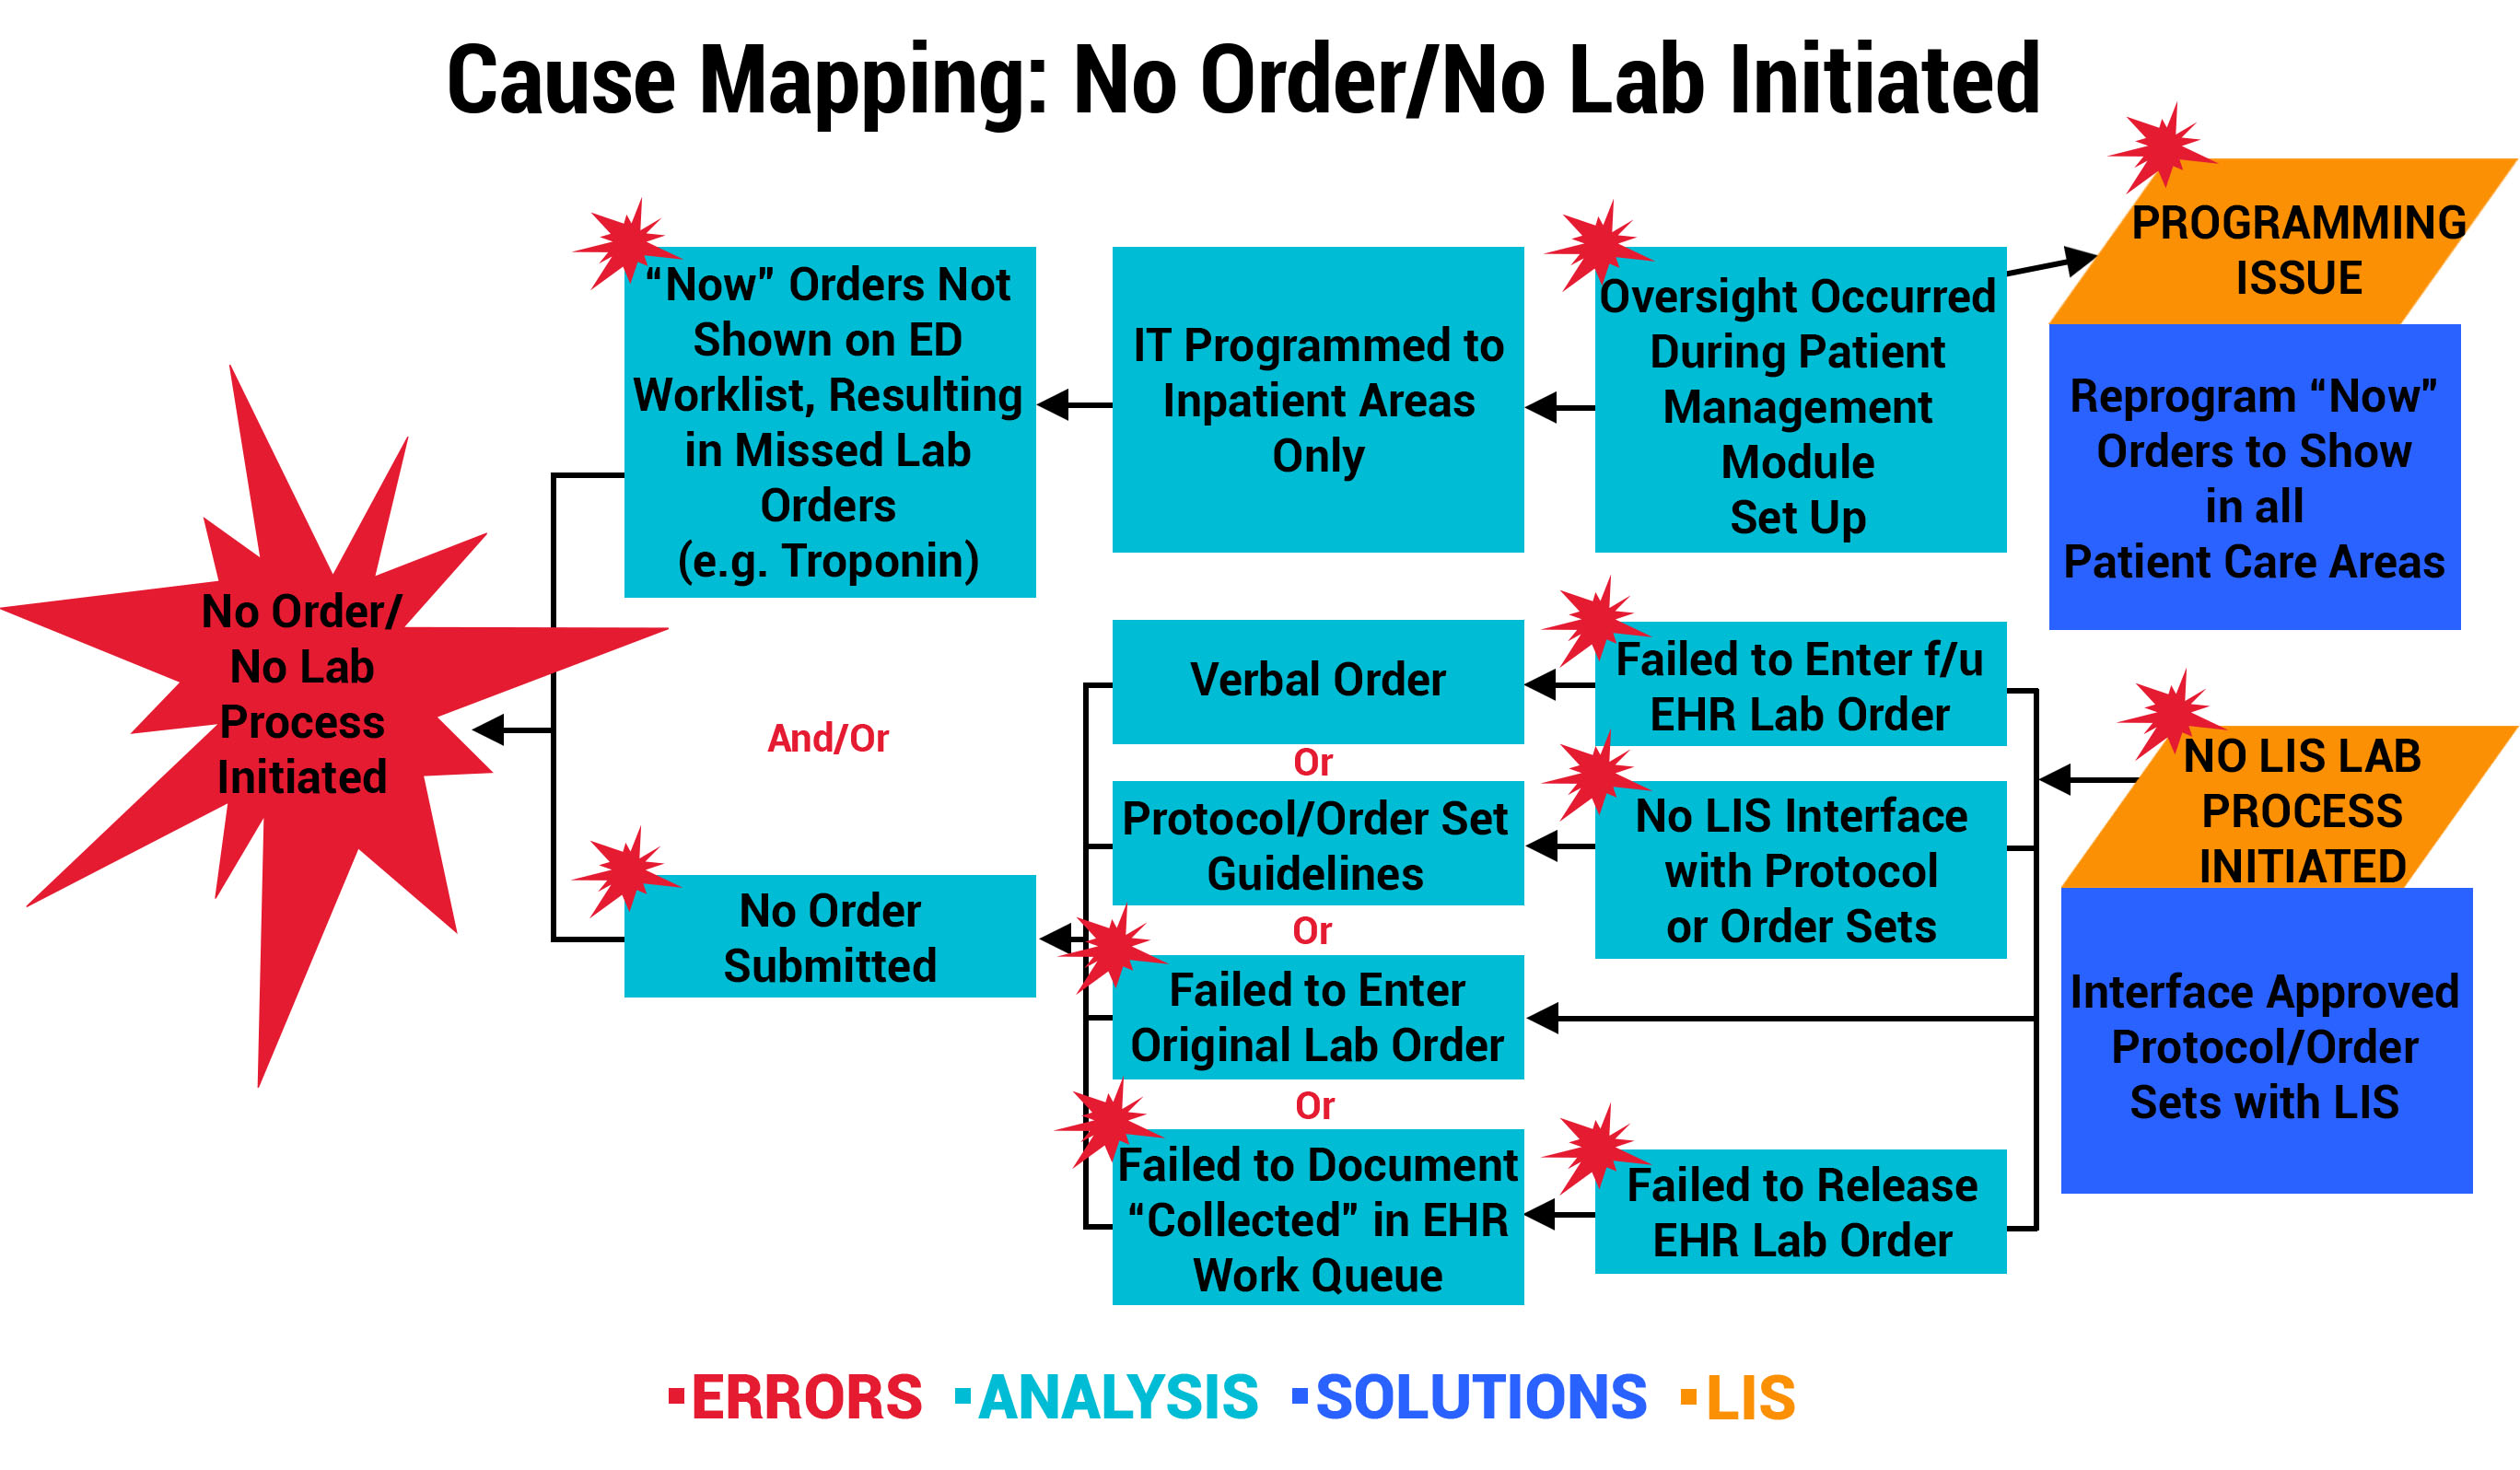
At one participating organization, a physician reported a specimen event that resulted in a delay in treatment after a Troponin “Now” order was not drawn or resulted in the Emergency Department (ED). Investigation revealed that “Now” orders were not programmed by the LIS/EHR mainframe to show in the ED nursing worklist. Instead, “Now” orders were only displayed in the Patient Management Transfer Module on the receiving unit to be carried out on transfer. The multidisciplinary team mapped the error below, and the solution involved an LIS programming change to allow “Now” orders to appear on the current location, including ED nursing worklists. This is a perfect example of how a single event investigation can result in a system-wide improvement.
Outcome 2: Lab Policy Change Permits Critical Values to Post in EHR
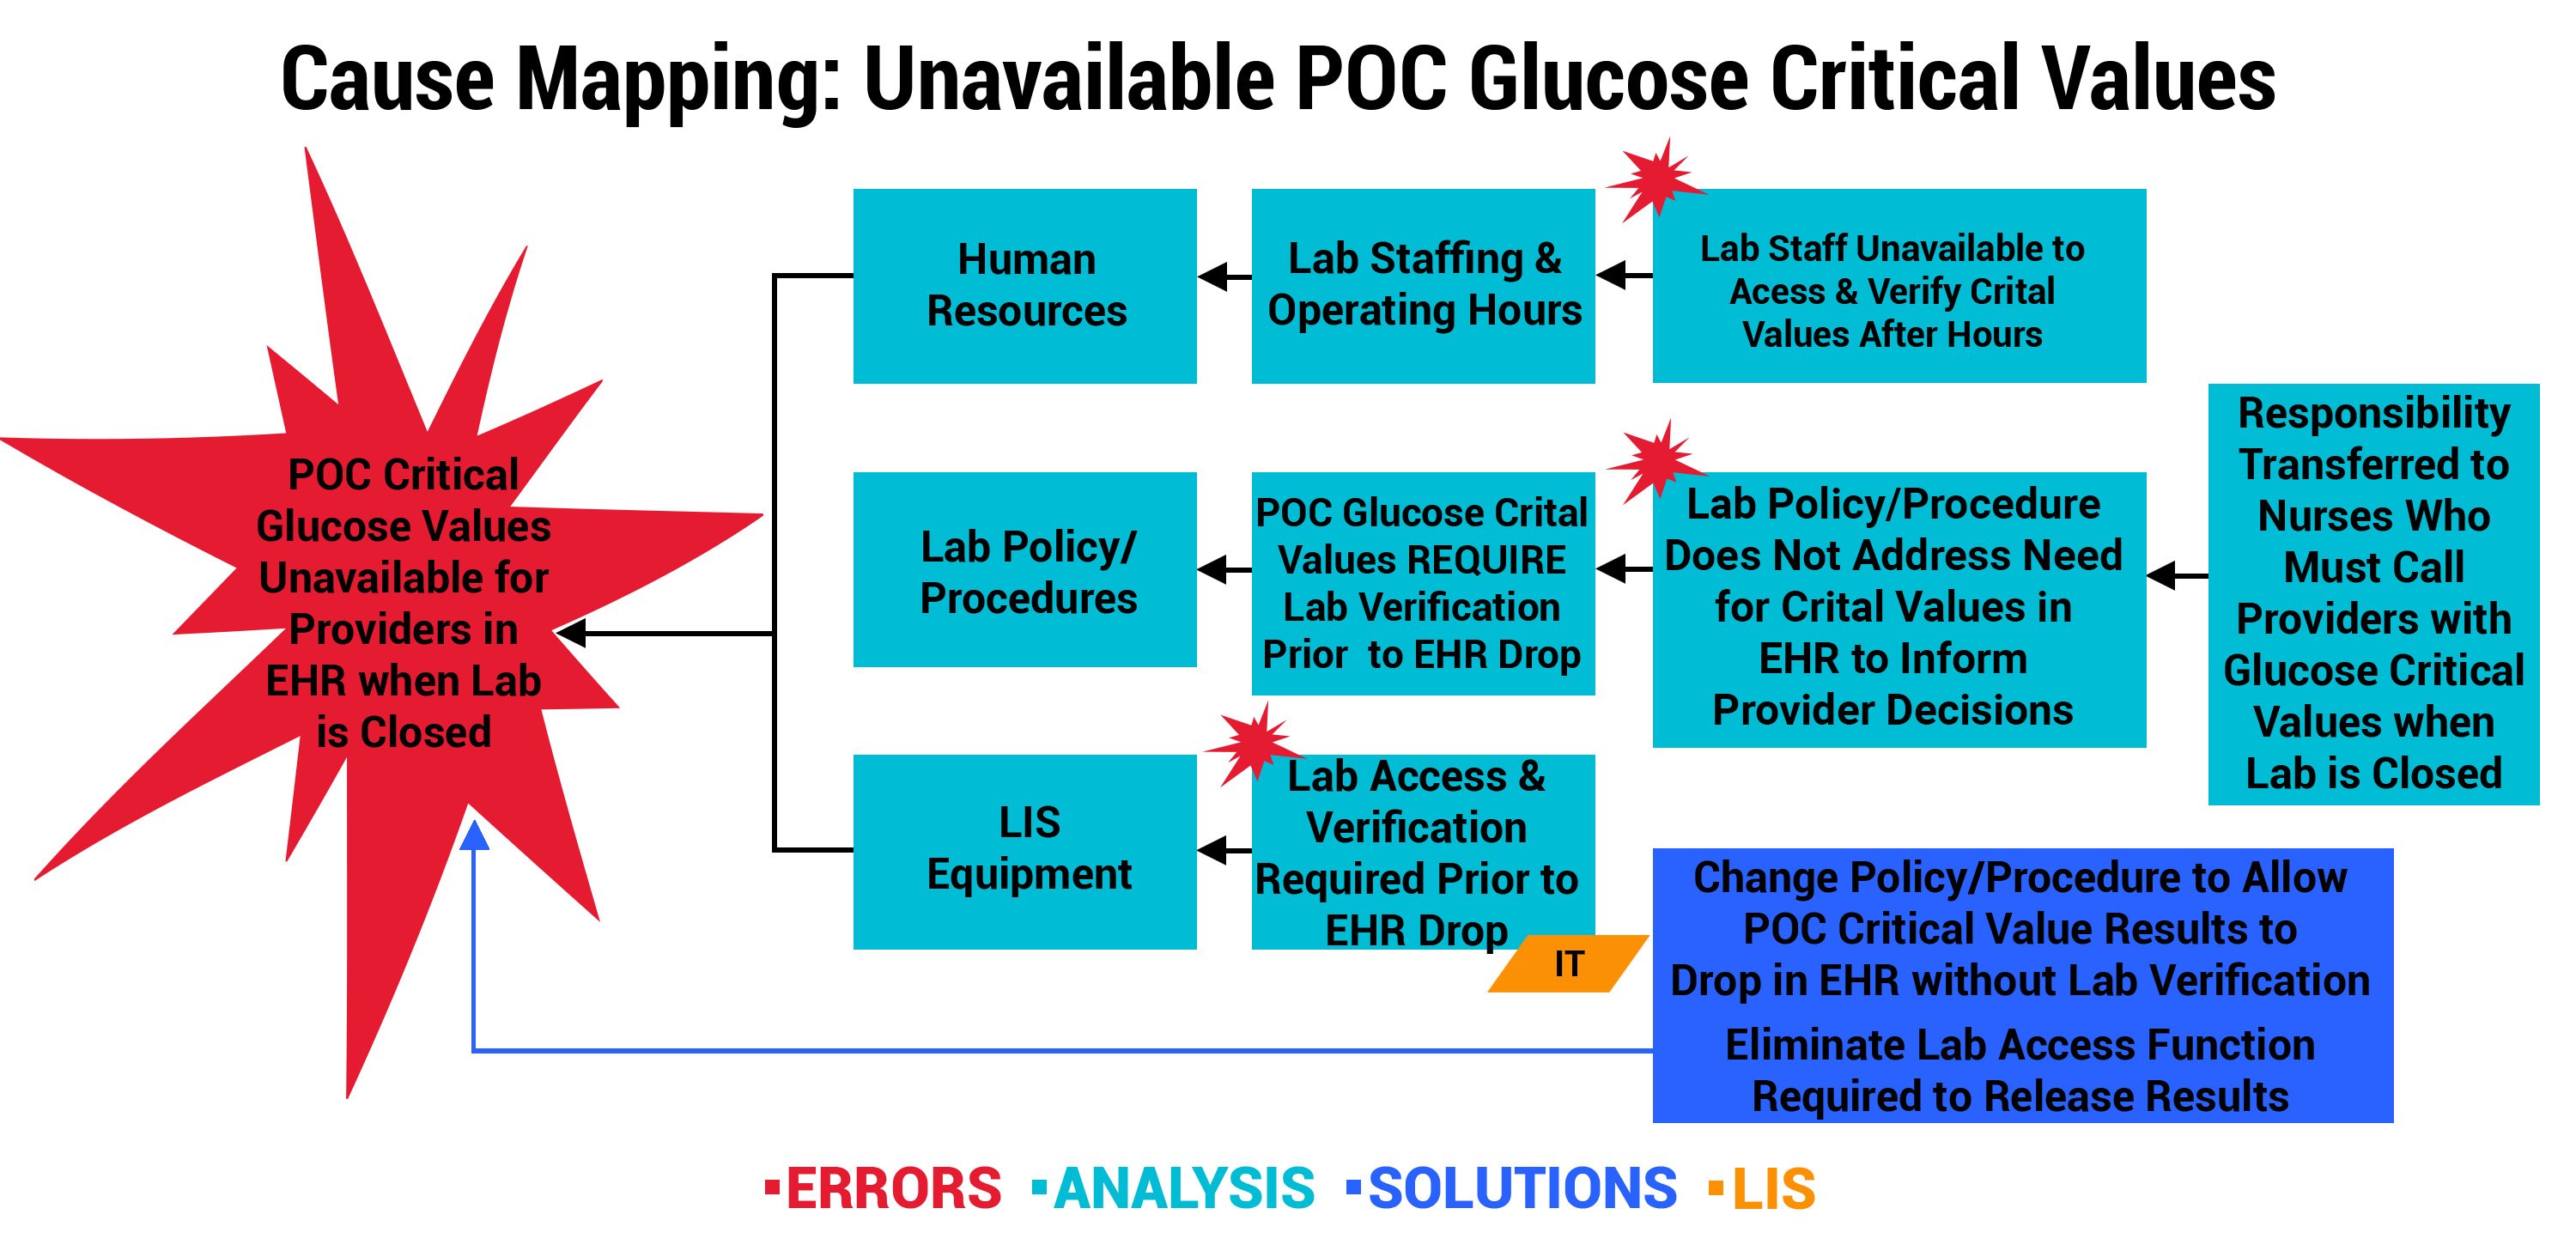
One of the smaller, rural participants noticed events involving critical results for point-of-care (POC) blood glucose testing. By organizational policy, critical values for POC glucose required verification by laboratory staff prior to posting in the EHR. However, laboratory oversight was only available Monday through Friday, from 5 AM to 5 PM. This meant critical values were not available to providers via EHR during laboratory off-hours, leaving potential gaps in the information needed to guide care. The organization engaged key stakeholders who took prompt action. As seen below, the error was multi-pronged. The immediate solution was to change the verification policy/procedures and allow the LIS to post critical results in the EHR when the lab is closed.
Outcome 3: Hemolysis Prevention Program Leads to New Nursing School Curriculum
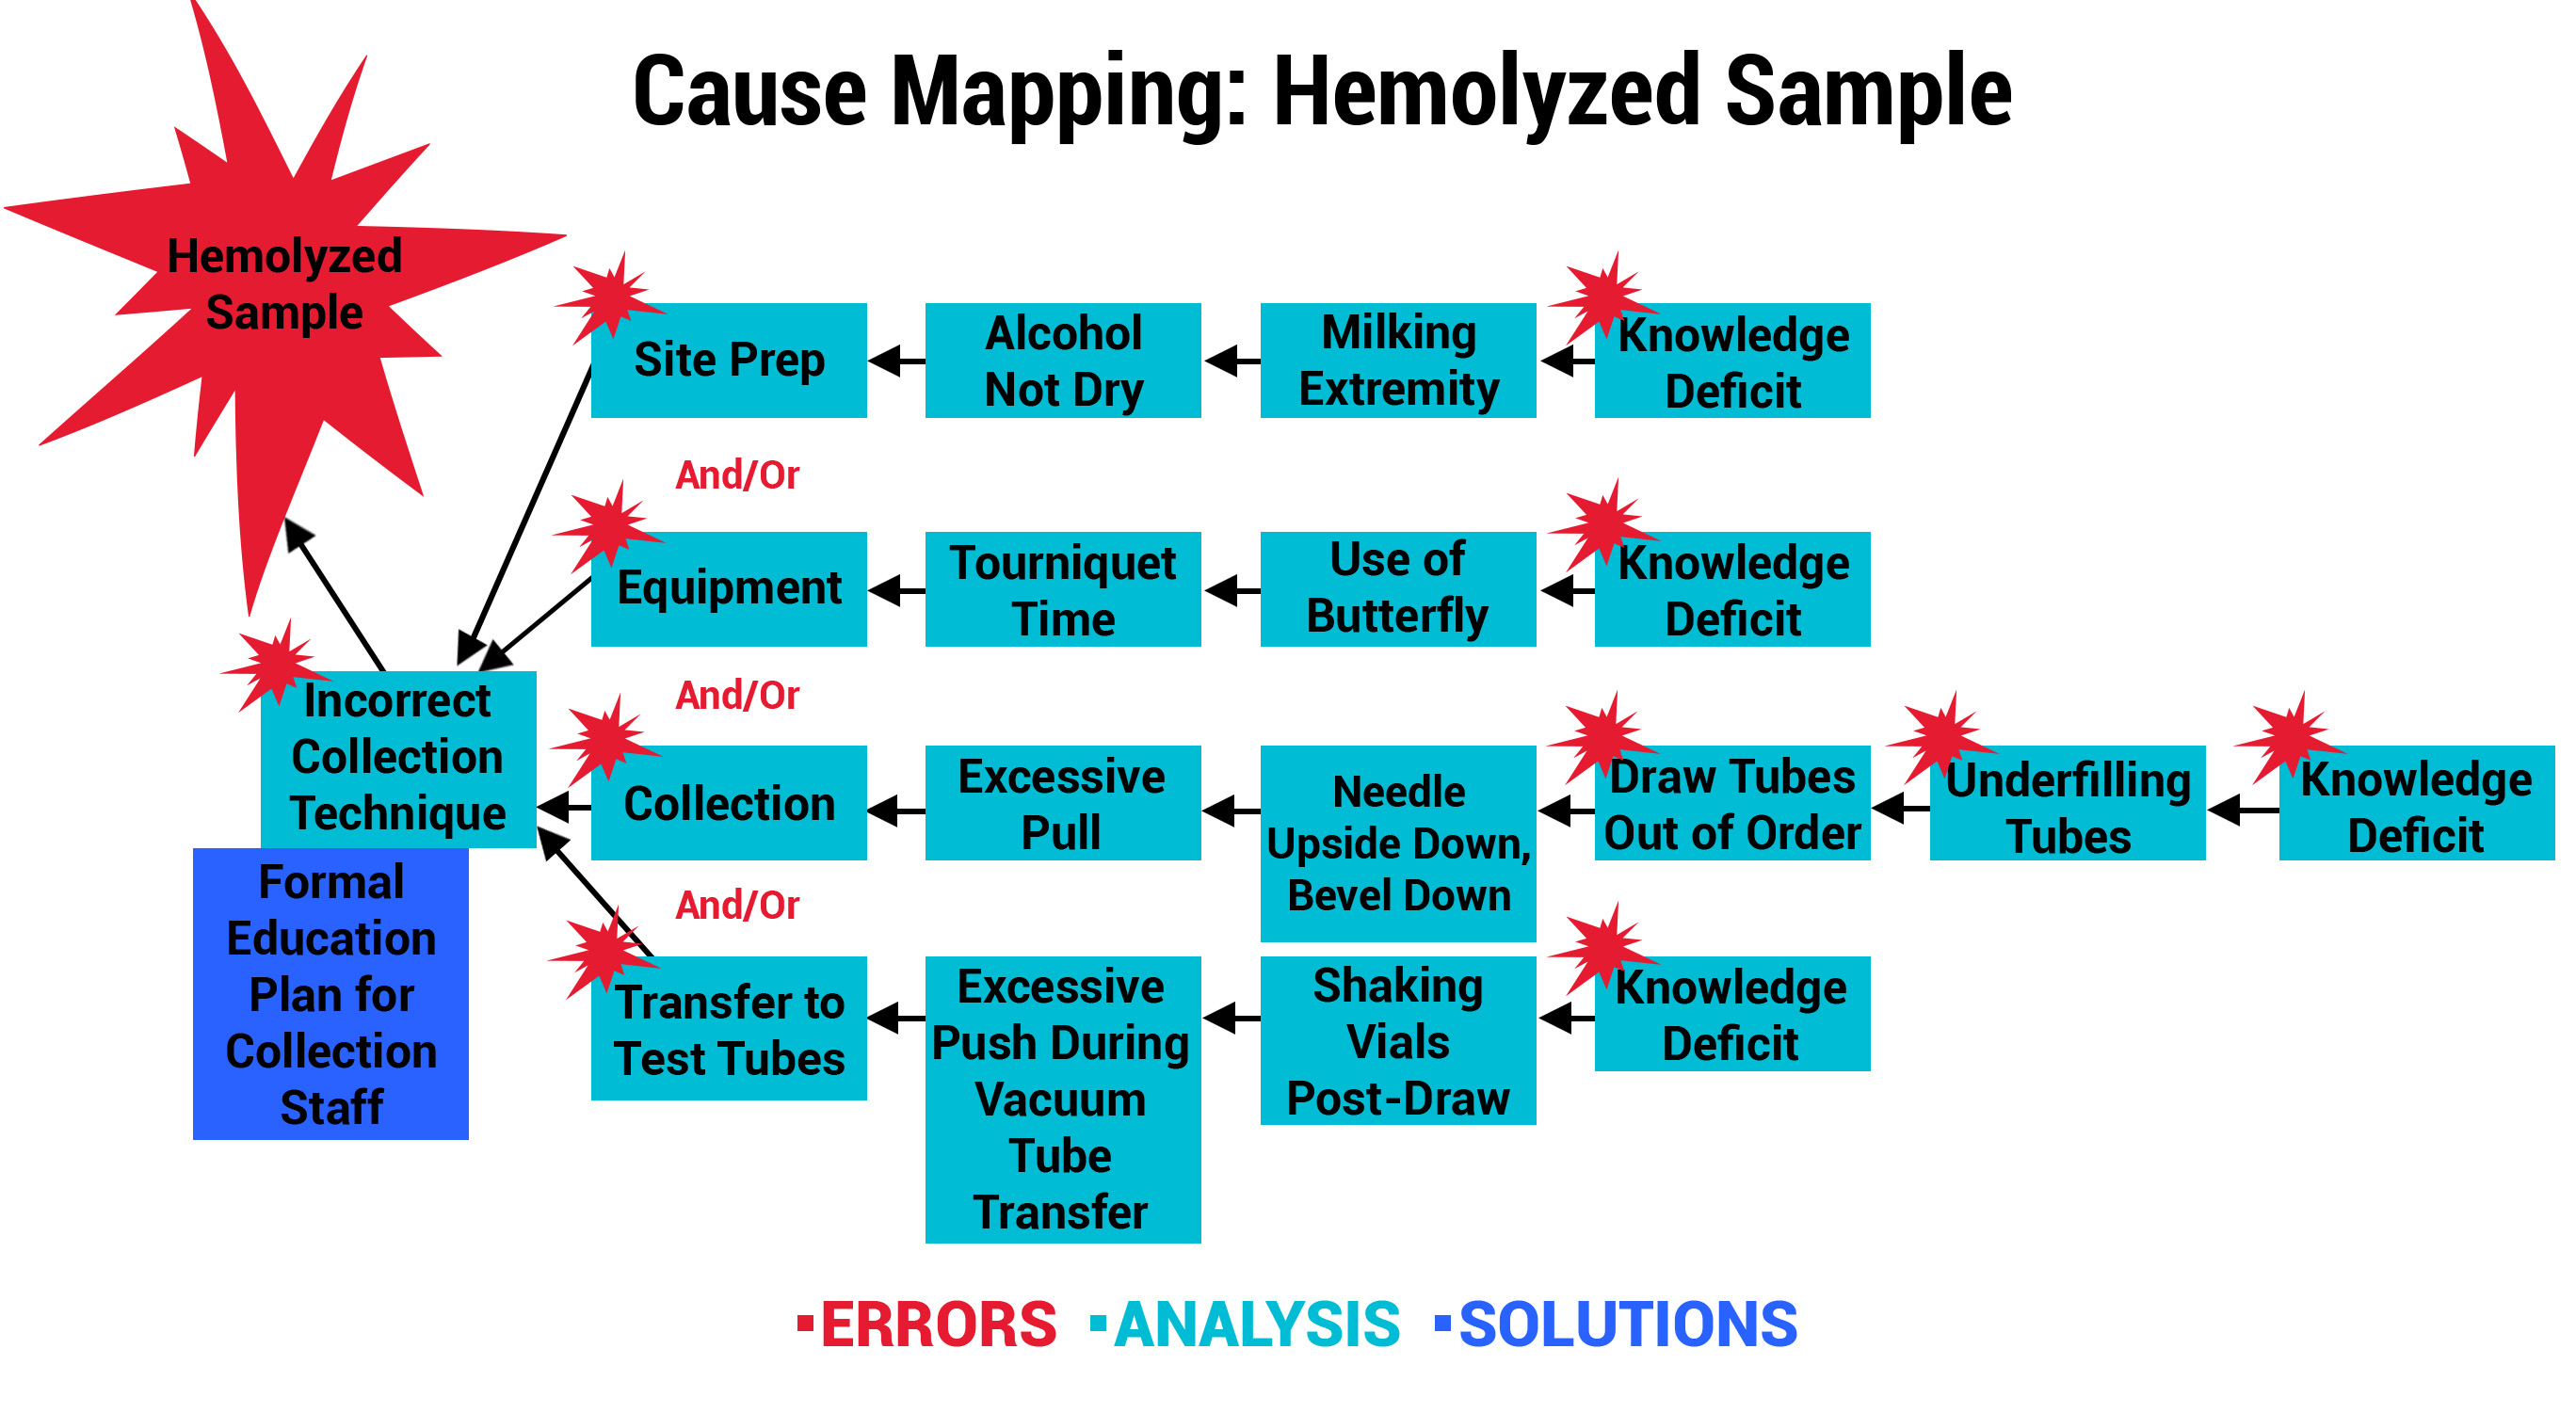
Another participant, a large urban hospital system, analyzed its Collection and Labeling errors to uncover a trend involving hemolyzed samples. The organization recognized that hemolysis occurs when obtaining the specimens, which are primarily collected by Nursing Staff in their hospitals. A knowledge assessment was performed, which confirmed that the majority of the nurses were never formally trained in phlebotomy practices. As a result, the Education and Laboratory Departments collaboratively developed and piloted a formal training program with nurses in specialty care areas. Post-training competencies were validated, so the program was expanded to all in-house Nursing Staff. The participant astutely recognized an opportunity to achieve even greater success by partnering with their School of Nursing. The phlebotomy training was adapted and is now part of the school’s curriculum effective July 2019. This will not only positively impact their system of hospitals, but graduates from the School of Nursing will take the phlebotomy skills with them to future positions and employers.
Outcomes & Reflections on Specimen Errors
In addition to examining process steps and error causations, ADNPSO analyzed outcome data. The Specimen Form captures patient outcomes resulting from incidents. Based on ADNPSO’s aggregate data, the most commonly reported Patient Outcome was Blood Redraws at 44.59%, followed by Delay in Treatment at 28.15%. Both directly impact the quality and safety of patient care, and also have financial and patient satisfaction implications.
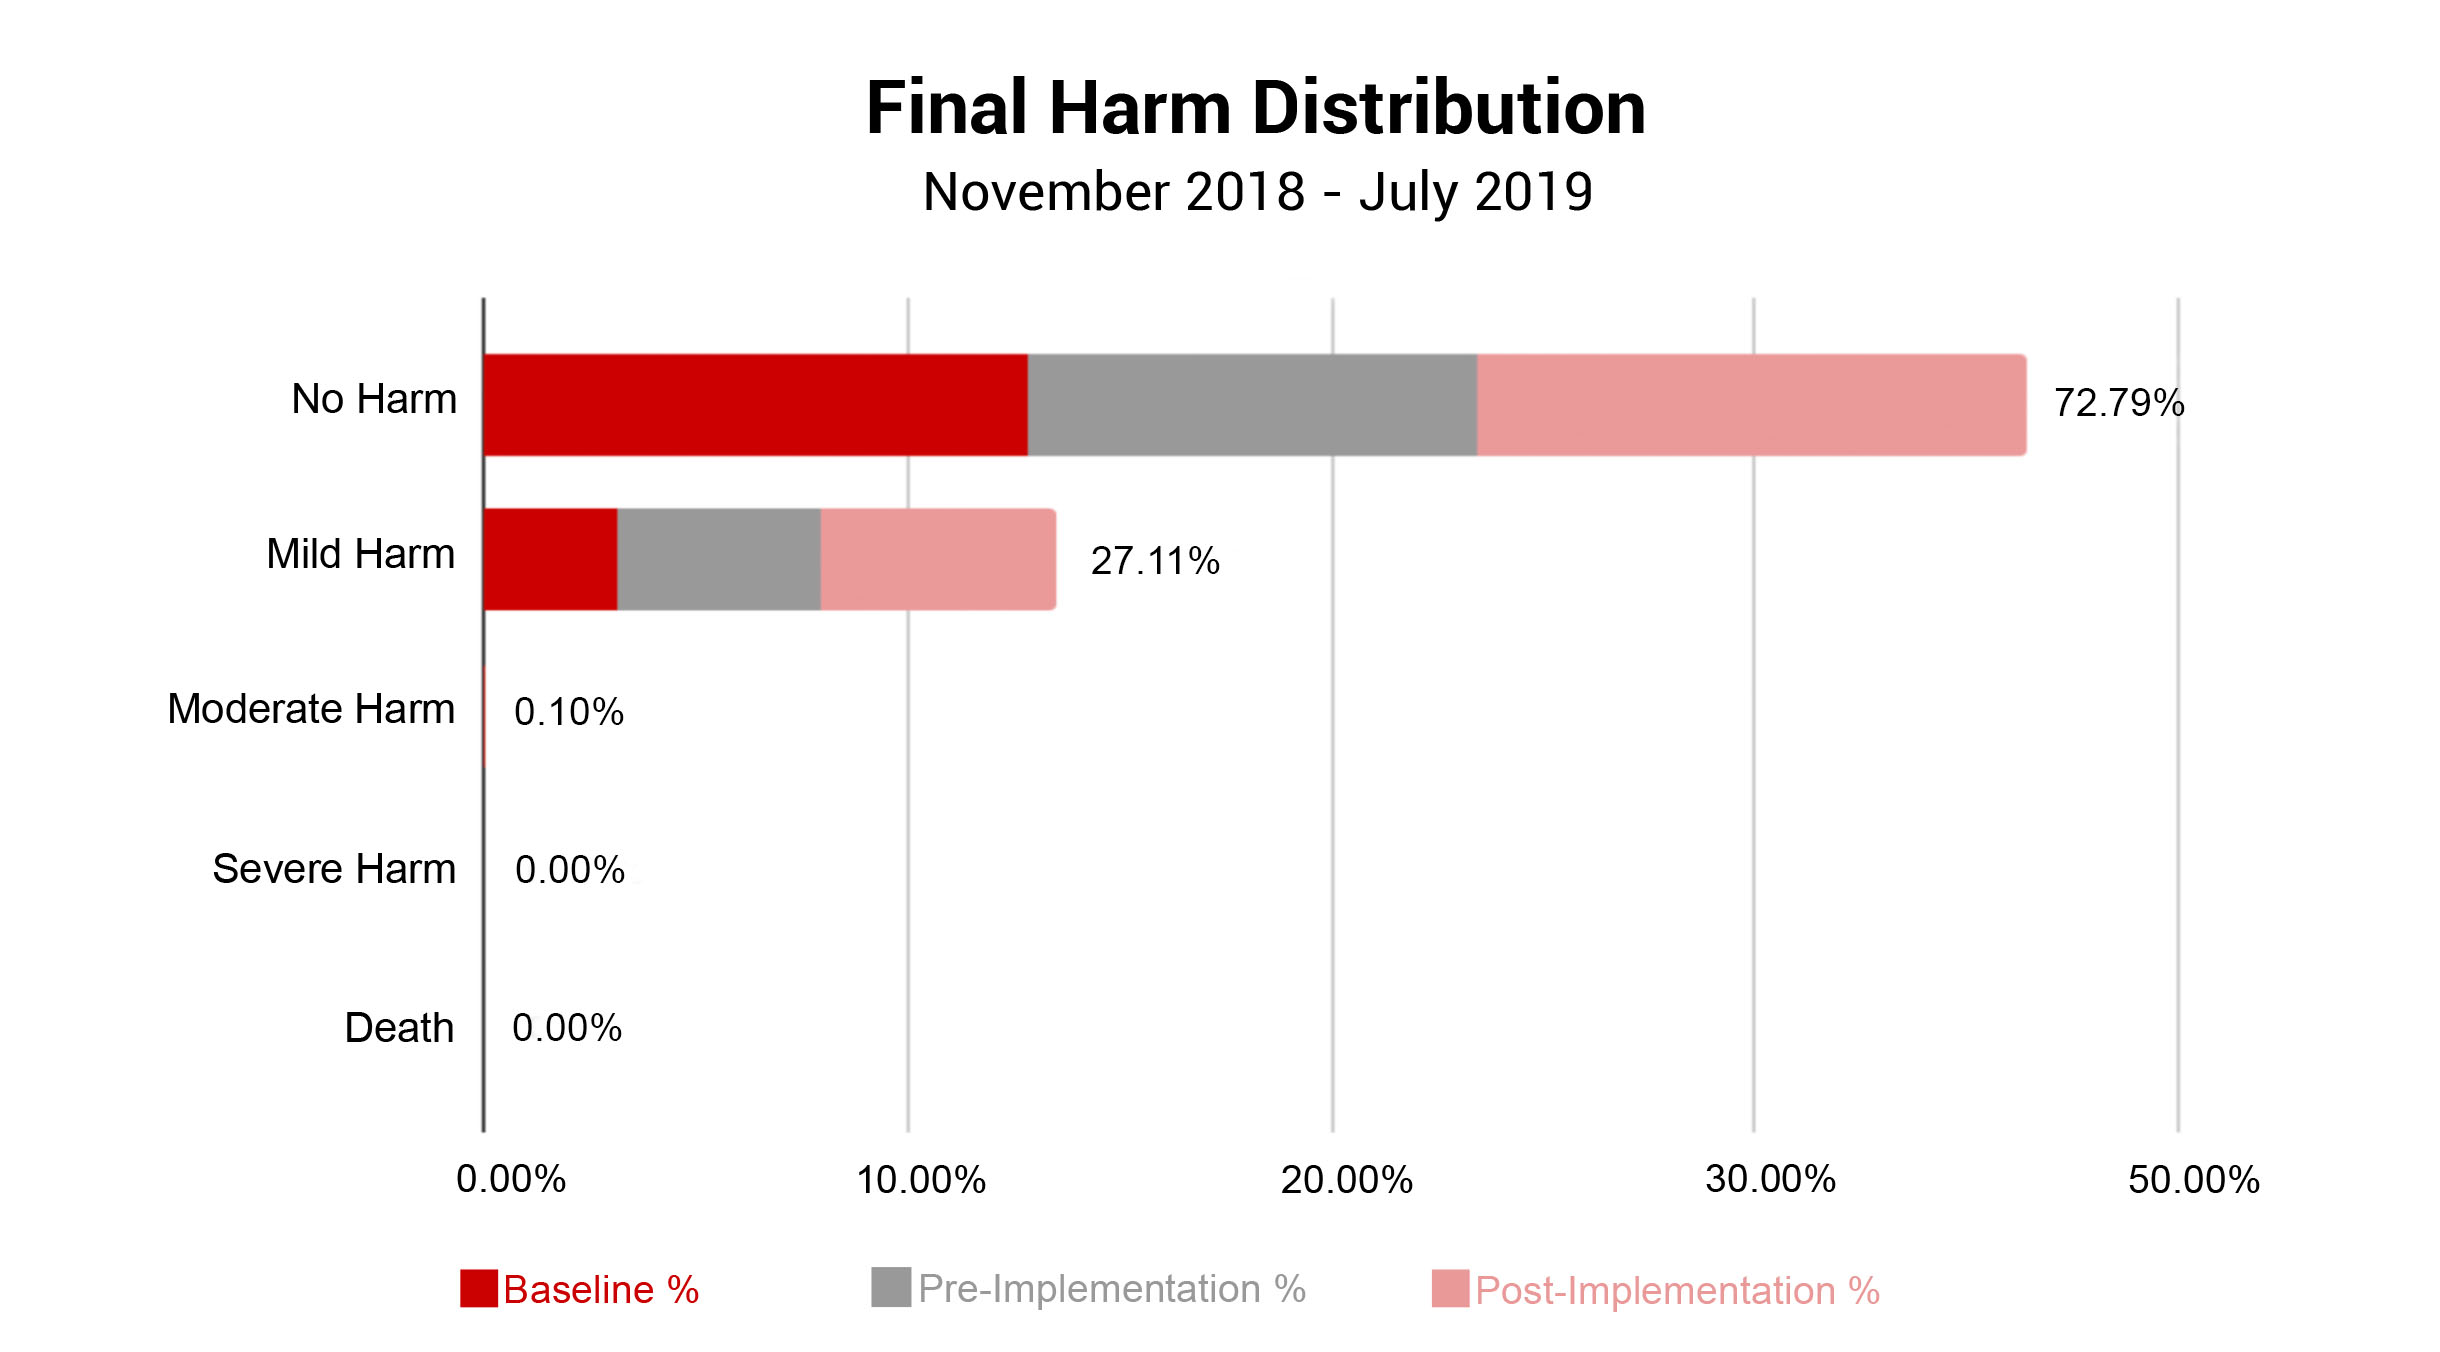
In conjunction with Patient Outcomes, ADNPSO evaluated the Final Harm of all submitted specimen incidents. Note, Risk Managers assign Final Harm upon event closure using AHRQ’s Harm Scale. As seen in the graph below, specimen incidents most often resulted in No Harm (72.79%) or Mild Harm (27.11%). Given that approximately 73% of specimen incidents led to Redraws and Delays in Treatment, ADNPSO reviewed the AHRQ definition of Mild Harm: “Bodily or psychological injury resulting in minimal symptoms or loss of function, or injury limited to additional treatment, monitoring, and/or increased length of stay.” With this in mind, ADNPSO challenged study participants to consider the definition and the associated patient outcomes when designating Final Harm. Subsequently, a slight increase in Mild Harm was noted in the Pre-and-Post Implementation Phases of the study when compared to Baseline.
Calculating Avoidable Costs of Specimen Errors
Assessing the financial impact of specimen errors proved challenging. Research showed that most calculations relied on the physical costs associated with rework, recollection and retesting of specimens. Examples of physical costs include:
- Labor: Time spent per discipline.
- Materials: Tubes, butterfly, bio bags.
- Lab Testing Supplies: Reagents.
However, there are also soft costs associated with adverse specimen events that can negatively affect patient satisfaction and length of stay, as well as result in injuries, misdiagnoses and delayed or unnecessary treatments. The financial ramifications of these costs are far more difficult to quantify.
To address this, ADNPSO used existing studies focused on physical costs to frame our calculations. A literature review estimated specimen error costs can range between $289 to $712 each.3,4 ADNPSO applied these cost ranges to all Specimen Redraws and Recollections reported during the nine-month study and calculated the total Potentially Avoidable Costs as $420K to $1.04M. Organizations can utilize these ranges to approximate their avoidable costs, or work with their Finance Department to identify and calculate actual costs.
Specimen Study Results
The success of the study hinged on the strong engagement of participating hospitals. ADNPSO was pleased to report that 100% of participants submitted data throughout the study and shared their internal corrective action plans and results.
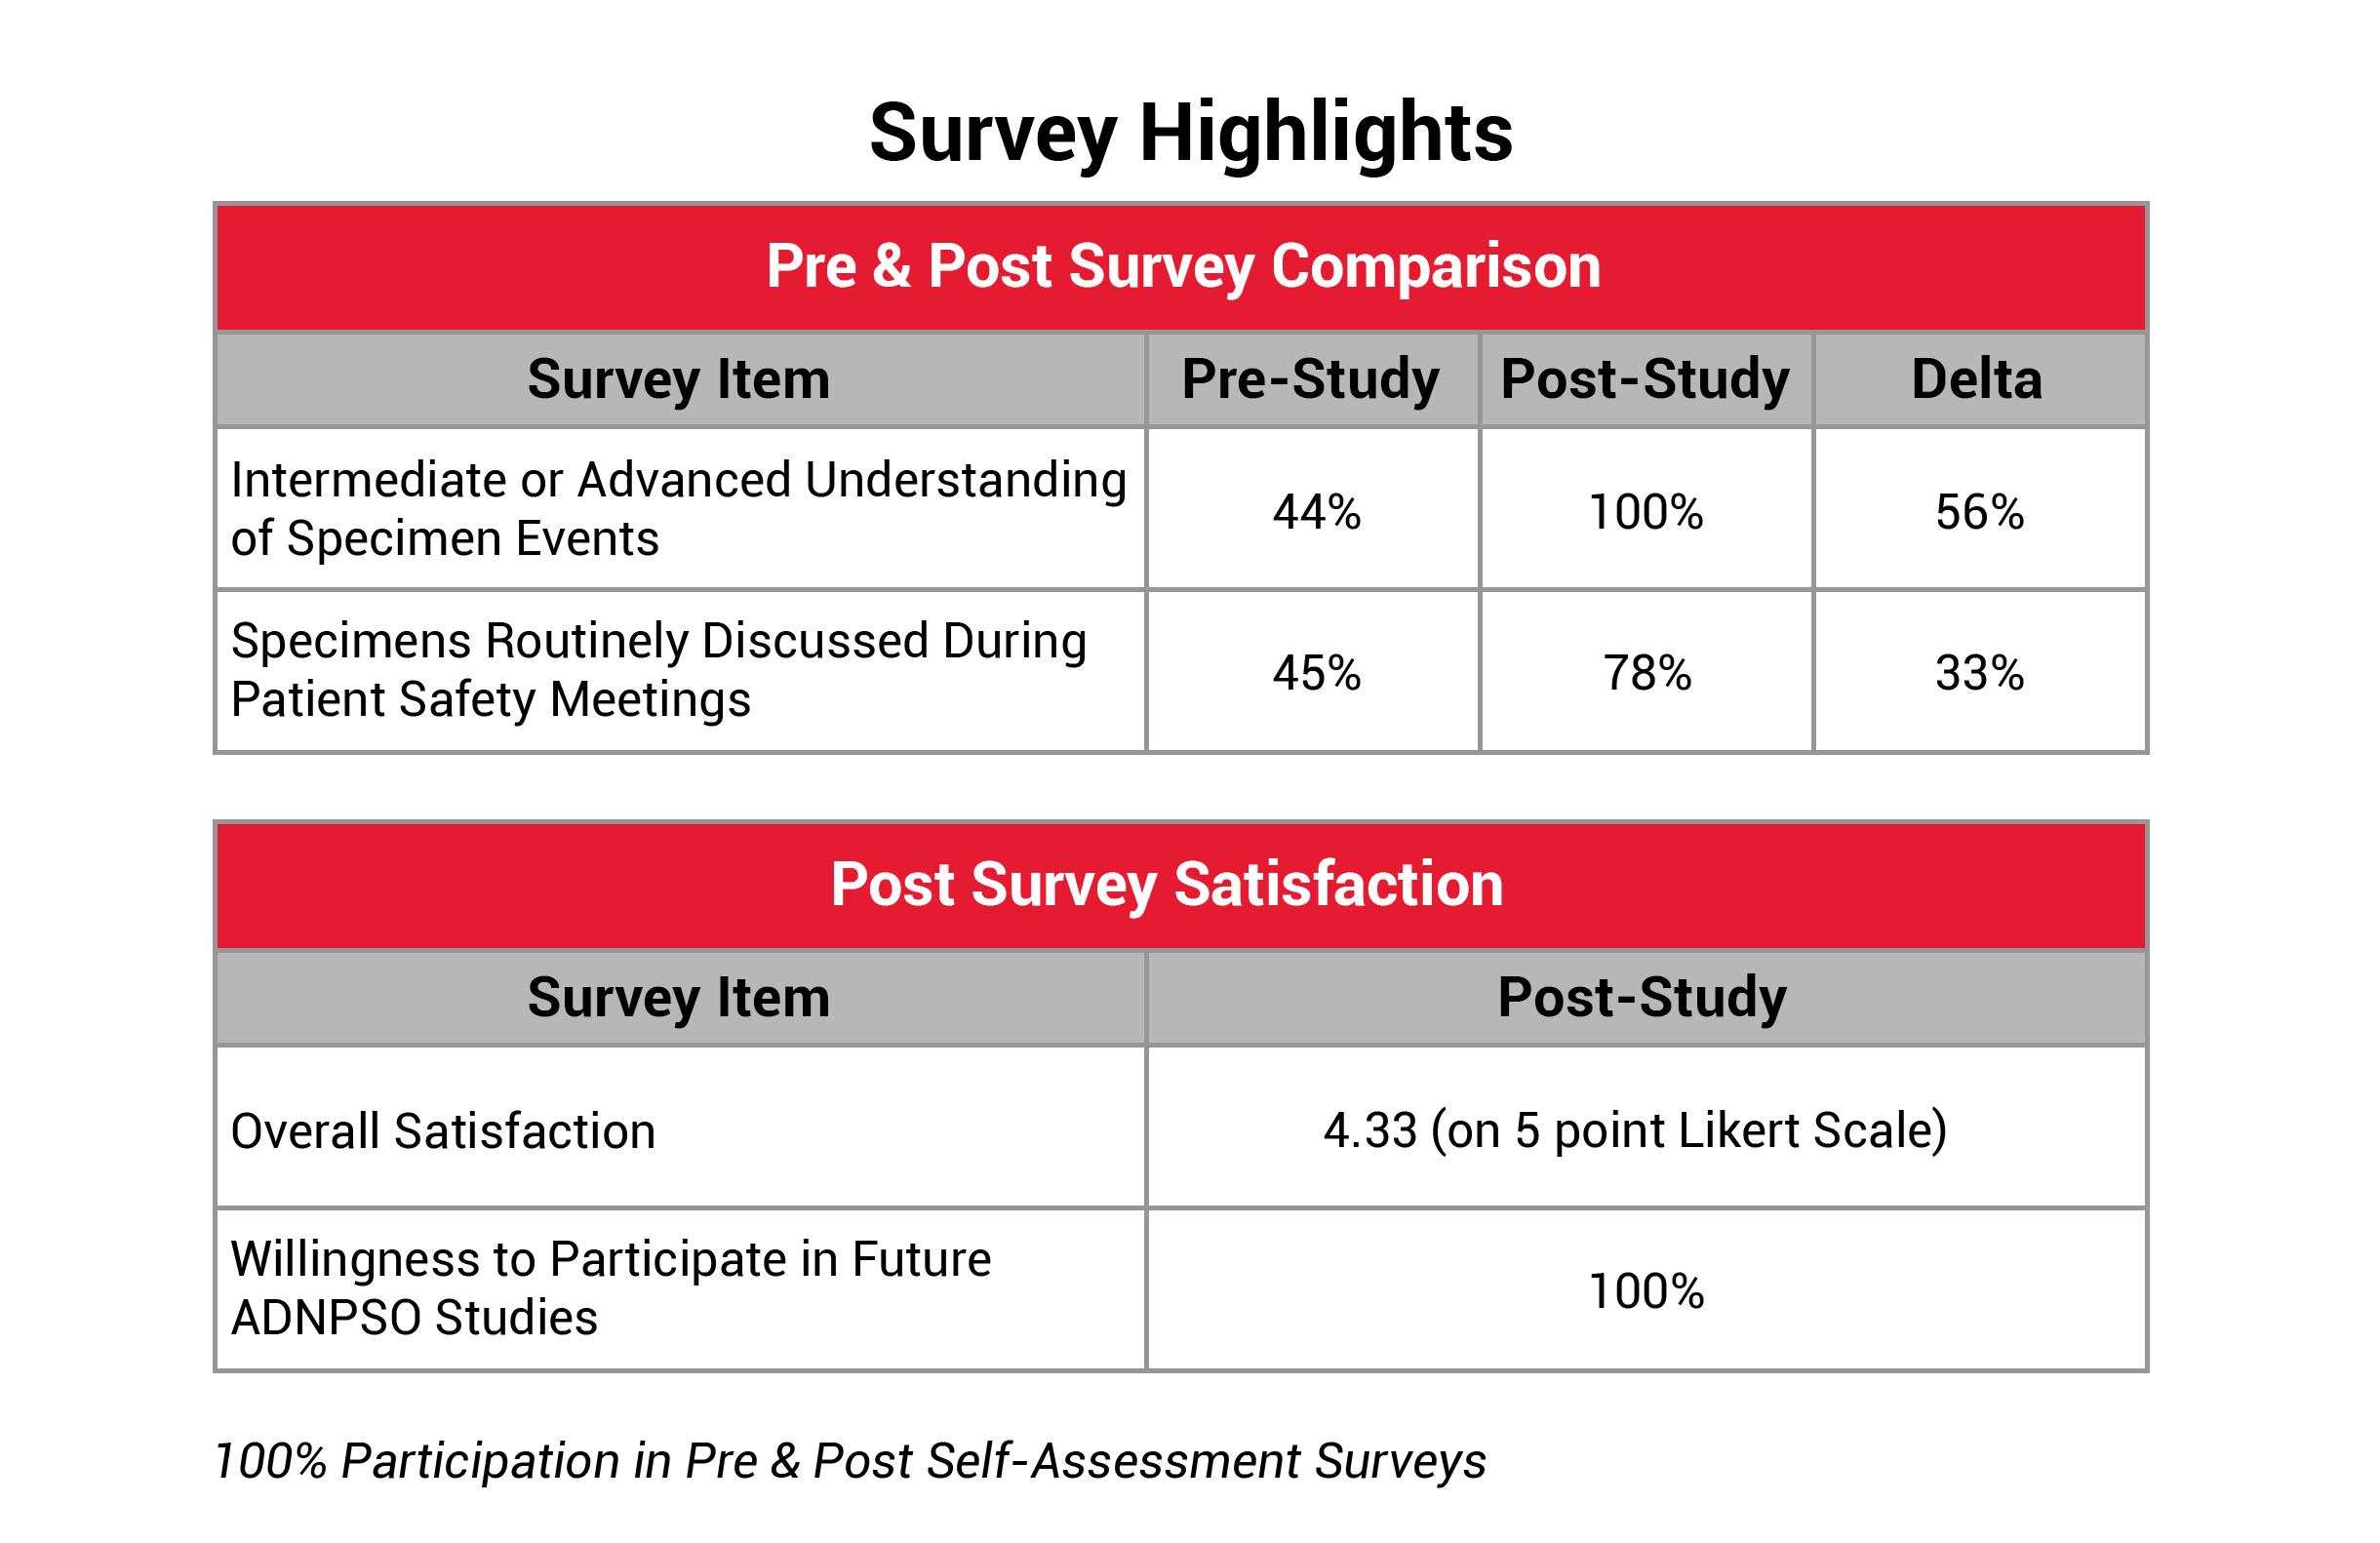
To further quantify the study’s success and pinpoint areas for improvement, ADNPSO developed a Self-Assessment Survey. This survey was issued to all participants at the beginning of the study to establish baseline perspectives and again upon study completion to evaluate the organizational impact. ADNPSO received feedback from 100% of participants for both surveys. The results revealed that 89% of post-survey respondents described their organization’s culture of safety as Engaged, and 11% described it as Empowered, reflecting a well-prepared environment for tackling system fractures. Additionally, participants reported a significant increase in understanding and discussing specimen errors during patient safety meetings. The Overall Study Satisfaction was rated 4.33 on a 5-point Likert scale, and all participants expressed plans to join future ADNPSO studies.
Successes
Increased Reporting: ADNPSO compared the aggregate number of specimen events reported nine months prior to the study to those submitted during the study period. A 147% increase in specimen event reporting was observed.
Positive Cultural Impacts: Following the study, participants reported increased leadership support and interest in the hospital’s ROI, enhanced collaboration among quality, lab, and frontline staff, and an stronger sense of empowerment and ownership in finding solutions. Additionally, physician engagement in specimen reporting and improvement efforts increased.
“Learning to Report & Reporting to Learn”: Participants embraced ADNPSO’s mantra, recognizing how critical event reporting is to maintaining and improving patient safety. Post-survey responses showed a 67% increase in education on reporting specimen events and understanding the value and purpose of reporting over the pre-survey responses.
Facility Size Doesn’t Matter: The study demonstrated that regardless of an organization’s size or budget, all hospitals have the capacity to engage and empower their staff to drive improvements in specimen processes.
Challenges
Varying Levels of Engagement: While 100% of the facilities engaged during the study, some were more proactive and responsive than others. ADNPSO sought feedback and found the reasons for lower levels of engagement included competing priorities, limited resources, multiple roles and the lack of a program champion.
Events Tracked Outside ADN’s Event Reporting Application: Some specimen-related issues were tracked via internal laboratory logs or other systems. For those who continued to track separately, this may have impacted their ability to accurately quantify and dissect data, resulting in missed opportunities.
OFIs for Data Collection Form: Analysis revealed a need to capture additional details related to causation, thus minimizing the need for manual review of free-text fields. ADNPSO plans to modify the Specimen Form to include additional questions and more structured answer options.
Lack of Near Miss Reporting: Near miss reporting provides an opportunity to identify and address fractured processes before they result in harm. The study revealed a limited number of near miss reports, highlighting the need for an intentional Good Catch Campaign to promote near miss reporting.
Difficult to Quantify Financial Impact: The soft costs associated with misdiagnoses, patient satisfaction, and extended lengths of stay are difficult to quantify. ADNPSO is committed to working closely with participants to tackle this challenge.
Key Takeaways
- Specimen process awareness is key to propelling improvements.
- Redesign process steps to minimize risk for errors and distractions.
- A single event investigation can result in system-wide improvements.
- IT partnership and LIS optimization are essential.
- Successful education is designed to:
- Target roles/responsibilities specific to the staff levels involved.
- Provide rationale for standardized process steps.
- Include examples of how workarounds lead to negative outcomes in subsequent stages.
- Engineer change with persistence and reinforcement to create a new normal.
References and Resources
- Specimen Errors: Examining the Quality, Patient Safety & Financial Impacts
Phyllis Ragland, Stephanie Iorio, Meredith Chappell
- Green, S. F. (2013). The cost of poor blood specimen quality and errors in pre-analytical processes. Chemical Biochemistry, 46, 1175-1179.
- Kahn S, Jarosz C, Webster K, et al. Improving process quality and reducing total expense associated with specimen mislabeling in an academic medical center. Poster. 2005 Institute for Quality in Laboratory Medicine Conference: Recognizing Excellence in Practice. April 28, 2005. acutecaretesting.org/en/articles/specimen-mislabeling-a-significant-and-costly-cause-of-potentially-serious-medical-errors
- Latino RJ. Case Study 3: Specimen Integrity Opportunity Analysis. Patient safety: the PROACT root cause analysis approach. Boca Raton, FL: CRC Press; 2009. P. 183-87. alraziuni.edu.ye/book1/nursing/PATIENT%20SAFETY,%20The%20PROACT%C2%AE%20Root%20Cause%20Analysis%20Approach%20(2009).pdf


